For many outside the scientific community, climate models often appear as sources of detailed views of the future—a kind of “digital twin” of Earth capable of resolving everything from large-scale regional hazards like droughts to neighborhood-level floods.
While that perception makes for excellent marketing, from a scientific standpoint, it is very exaggerated. Climate models are first and foremost developed to advance scientific understanding of how the Earth system functions at global and regional scales. They were not created to provide business-ready risk assessments for site-specific assets.
However, with careful use, climate models can add value on practical decisions. This especially the case when climate model output is combined with assessment of model skill, desktop research, additional hazard modeling, and other sources of local knowledge.
Here, we explore four common misunderstandings or “myths” about climate models and associated applications, all drawing on insights from practical experience in the field and our research experience.
The four myths of climate models and downscaled data
Myth #1: Bias correction eliminates the need to worry about climate model errors
Myth #2: Climate models capture the extreme weather events we’ve seen recently
Myth #3: Higher resolution climate data gives better predictions of the future
Myth #4: Climate threshold indicators like days over 90°F are estimates of risk
The goal of this post is to help ESG professionals better understand the limitations of data and ask sharper, more informed questions of those who produce it. This matters because data literacy directly influences decision quality. This in turn impacts financial performance and organizational credibility and the use of scarce resources. A more knowledgeable user base will also drive improvements in data quality, how data is communicated, and the training of new professionals.
Misinterpreting model output can lead to misplaced confidence, exposure to regulatory risks, and inefficient capital allocation for resilience measures. In contrast, knowing how to smartly interrogate climate data fosters trust and transparency with clients, strengthens disclosures, and supports more resilient investment and adaptation strategies, ultimately enhancing company value.
Myth #1: Bias correction eliminates the need to worry about climate model errors
Bias correction can better align models with local climates, but it cannot fix deeper issues with the models themselves that limit their ability to project future changes.
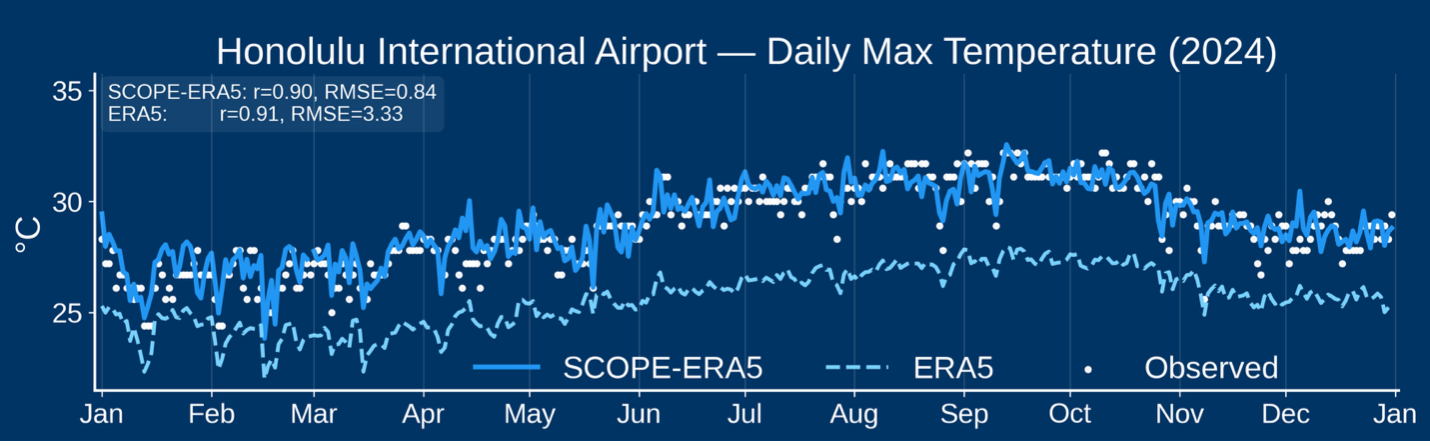
Climate models have been shown to perform well at projecting changes in global mean temperature. However, the local values from these models can diverge significantly from observed reality due to model biases and errors.
Climate models generate time series of weather variables on three-dimensional global grids, with each “grid cell” typically covering an area of about the size of NewJersey (150 km x 150 km). The values within these grids represent spatial averages of conditions simulated through mathematical representations of numerous physical and atmospheric processes. Because of both these approximations and the spatial averaging, the resulting numerical outputs exhibit systematic biases when compared with observed local climates. Raw model data can diverge noticeably from real-world conditions at specific locations.
These biases may mean that models simulate regional temperatures that are several degrees warmer or cooler than observed, or produce rainfall amounts that are consistently too high or too low. They can also struggle to reproduce the intensity of extreme events. These differences don’t make the models unusable or wrong, but they do mean that additional post-processing steps are needed.
To make climate data more suitable for decision-making, model outputs are typically spatially refined and calibrated to better reflect observed local conditions. This process—known as downscaling and bias correction—helps translate coarse global model results into information that is more relevant and realistic for site-level analysis in climate risk assessments.
Bias correction improves climate model performance but does not solve all underlying issues with climate models.
Bias correction training data accuracy is important.
Bias correction is only as good as the data used to train it. Training data is often labeled as “observations”. However, not all training data are true observations—many training datasets are them selves derived from models, such as ERA5. If training datasets contain biases, the adjusted climate data will be calibrated with a model’s view of the world and not real observations. In such cases, downstream analyses may over-or under-estimate conditions such as the number of very hot days in urban areas or the extreme rainfall totals.
Bias correction cannot add "missing" weather events
Global climate models do not explicitly resolve small-scale events such as hurricanes, tornadoes, or local convective downpours. Bias correction typically adjusts large-scale temperature and precipitation fields that have some association with these events, but they cannot simply “create” or “add in” these weather events. Specialized high-resolution or event-based modeling is needed when those hazards are material to the decision-making context.
Bias correction cannot make climate models more accurate.
Bias correction does not make models better predictors of the future—it simply adjusts historical model output (“hind casts”) to better align with observed conditions. Efforts to weight or rank models based on historical performance are also problematic: a model that reproduces past trends well will not necessarily project future ones accurately, since the climate system behaves differently under changing greenhouse gas concentrations. Moreover, validating future projections is inherently difficult. We have only one unfolding climate trajectory, meaning projections cannot be back-tested or verified in the same way as financial models or short-term weather forecasts.
In reality, some regions have warmed faster than expected, while others have shown little or no change. When decision-makers rely solely on climate projections without checking against observed trends and other real-world data, the results could lead to false alarms, missed risks, and/or misallocated resources. Scientists have noted local-scale model errors involving overstated precipitation increases, exaggerated humidity trends, and underestimated heat extremes.

Simple bias correction methods can distort climate model projected changes.
There are dozens of bias correction techniques, ranging from simple average adjustments to more sophisticated statistical transformations. Simpler methods typically adjust only the mean and variance of model outputs, neglecting higher-order moments of the distribution that are essential for capturing climate extremes. As a result, they can unintentionally alter—or even dampen—the very changes in extremes that are most relevant for risk management.
Bias correction assumes stability over time.
Nearly all bias correction techniques assume that the correction derived from the training data remains constant over time—a proven poor assumption in some places. When underlying climate dynamics shift, these corrections may no longer hold, introducing new sources of error that result in projections of the future that the models didn’t produce.
Important questions to ask before using downscaled and bias corrected climate data:
- Do my near-term model projections align with observed trends?
- What are the limitations of the bias correction process and how might these limitations affect the decisions I need to make?
- Is the reference data used for bias correction accurate and appropriate for my purpose?
Myth #2: Climate models capture the extreme weather events we’ve seen recently
Climate models cannot fully simulate many high-impact extremes such as wildfires, floods, and even some heatwaves, in part, because these events occur at scales finer than the models can resolve. Decision-makers should instead work with hazard-modeling specialists who can translate climate projections into more realistic, business-relevant assessments of hazard and risk.
Global climate models (GCMs) are the primary tools used by earth scientists to assess how the planet responds to rising greenhouse gas concentrations. They simulate interactions among the atmosphere, oceans, land, and ice to project large-scale, long-term trends such as global temperature change, shifts in precipitation patterns, and ocean warming. Because they operate on coarse grids that average conditions over hundreds of kilometers, GCMs are most reliable for understanding directional global or regional change rather than local detail.
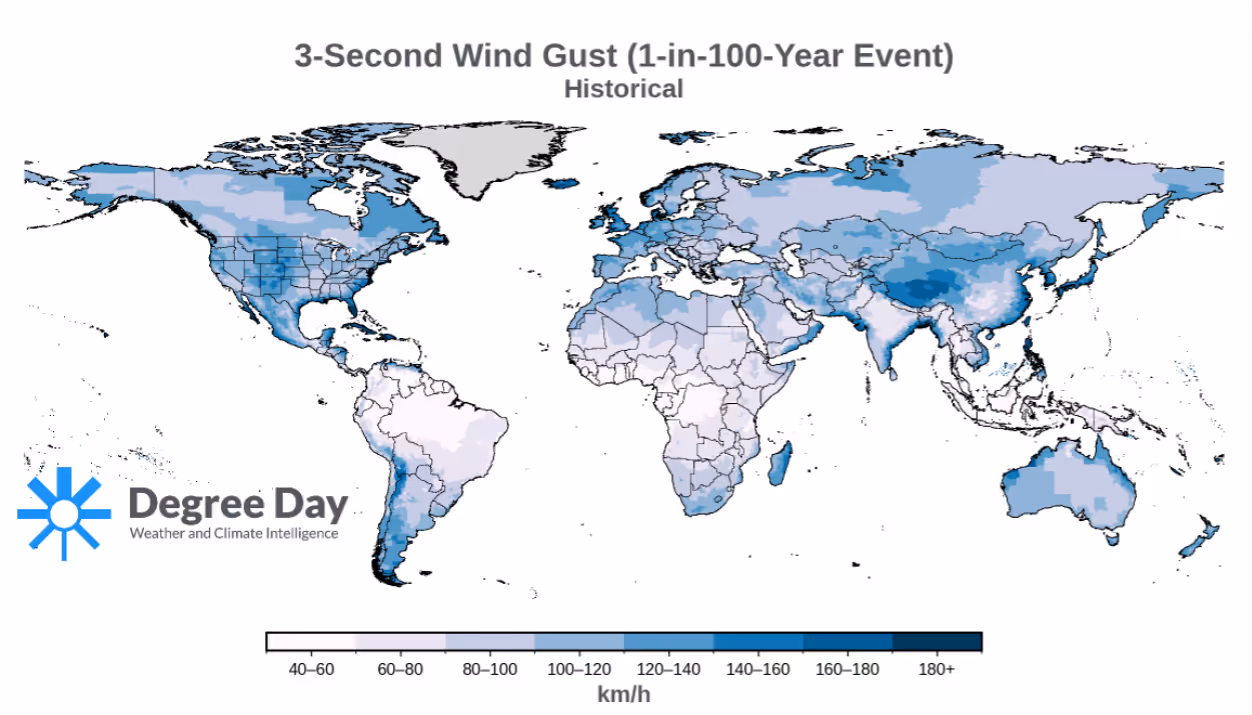
However, GCMs do not capture many of the extreme weather events that drive financial and operational risks—such as wildfires, floods, and severe storms. These hazards occur at scales too fine for GCMs or even higher-resolution regional models to resolve.
Even downscaled GCM outputs labeled as “surface wind” represent projected changes in large-scale, averaged conditions across grid cells that can span hundreds of kilometers. They do not capture localized, high-impact phenomena such as hurricanes, tornadoes, or thunderstorm gusts. These variables should not be interpreted as indicators of damaging wind potential and, in practice, have limited utility for assessing wind-related risks.
Overall, relying solely on GCM data can understate exposure to high-impact, localized extremes that matter most.
For decision-makers, the more effective approach is to engage hazard-modeling specialists who integrate climate projections into physically based or statistical hazard models. This allows future changes in hazard frequency and intensity to be represented more realistically—and in ways directly relevant to business risk, financial exposure, and asset management.
Hazards Not Fully Captured by Global Climate Models
Atmospheric and Temperature Extremes
- Heat waves*
- Cold waves*
- Urban Heat Island effects*
Hydrological Hazards
- Floods
- Freshwater Stress/ Availability*
- Storm surge
- Local sea-level rise*
- Coastal erosion
Severe Weather and Convective Hazards
- Hurricanes / tropical cyclones*
- Severe convective storms (thunderstorm wind gusts, derechos, tornadoes)
- Hail
Geophysical and Earth Surface Hazards
- Landslides
- Land subsidence
- Wildfires*
Asterisk (*) indicates phenomena that are partially simulated.
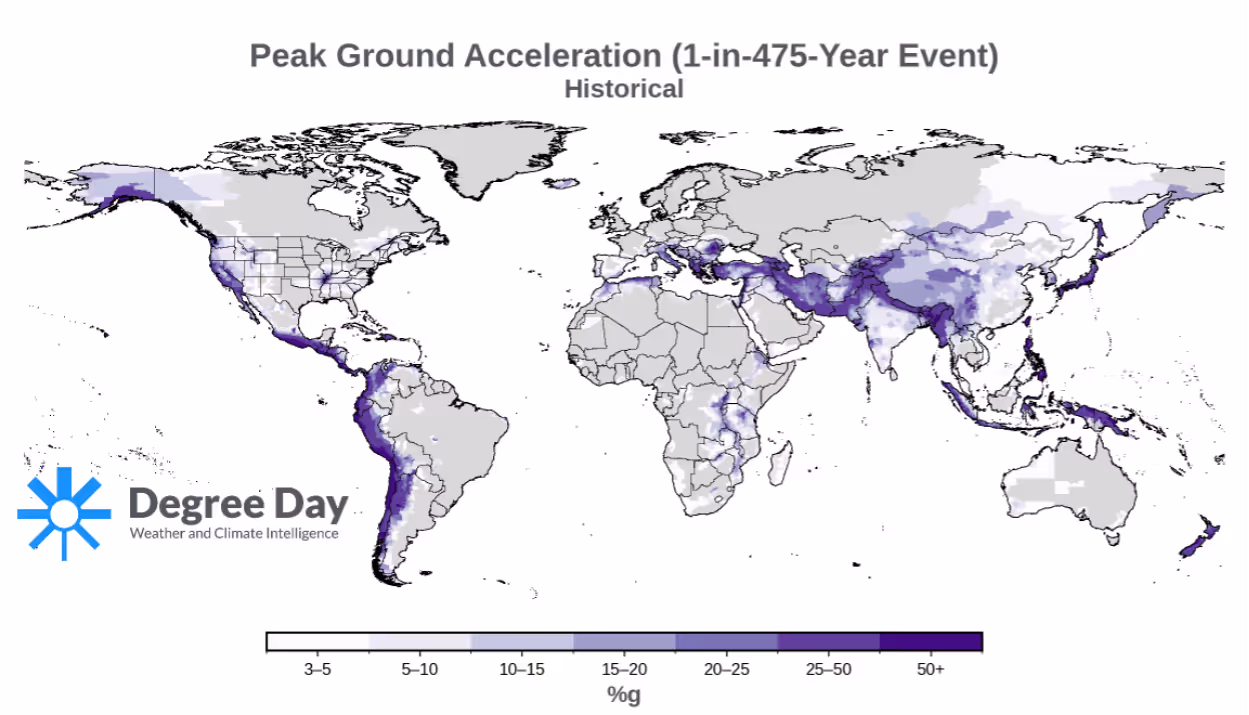
Forgotten Hazards: Earthquakes and more
The recent focus on climate change has sometimes overshadowed other major non-climate natural hazards that also pose material risks to businesses, such as earthquakes, volcanic eruptions, and tsunamis. A truly comprehensive risk assessment should encompass the full spectrum of hazards—meteorological, hydrological, geophysical, environmental, and even extraterrestrial (e.g.,geomagnetic storms)—to account for the range of shocks that can disrupt operations, supply chains, and asset performance.
Important questions to ask before considering climate model data:
- Do the climate models simulate the extreme weather events I care about?
- Are downscaled climate model output right for my specific use case?
- What other non-climate related natural hazards may be relevant?
Myth #3: Higher resolution data is always more accurate
Downscaled climate data does not guarantee better prediction accuracy. Compare models against local observations to ensure high-resolution maps reflect reality rather than highly precise, low-accuracy eye candy.
High-resolution downscaled climate data often gives the impression of accuracy because it looks visually detailed.However, precision and accuracy are not the same thing. A model can produce highly spatially detailed maps (precise) while still misrepresenting actual conditions (inaccurate). The appearance of detail can therefore mask underlying problems—especially if the data have not been calibrated or validated against reliable local measurements.
Extensive validation is not often performed in depth by dataset developers, in part because it can be extremely time-intensive and modelers may be reluctant todisclose the full extent of their models’ limitations or performance issues (no model is perfect). Independent third parties are typically needed to perform such validations, yet there is often little incentive for them to do so. This can make it difficult or impossible for end users to fully assess data reliability.
Spatial Refinement with Downscaling
Freely available statistically downscaled climate datasets are very popular with ESG tools, such as NASA’s NEX-GDDP. While these datasets appear highly detailed, it’s important to recognize that they are not suitable for all applications and are, in general, quite generic datasets. Their fine spatial resolution reflects historical climatology rather than true local-scale physics. The future climate change signal is imposed from coarse global models and applied uniformly, meaning the apparent spatial detail does not represent new or improved physical understanding of how local processes respond to warming. In short, these datasets can look precise, but the underlying climate signal remains as coarse as the global model (i.e., the size of New Jersey).
Regional Climate Models (RCMs) can help bridge this scale gap. RCMs operate at finer spatial scales—typically 10–50 km—over continental or sub-continental regions. They use global models as boundary conditions and then simulate regional climate dynamics within those boundaries at higher spatial and temporal resolution. In this sense, they act as “magnifying glasses” for global models, adding physical realism to processes that global models cannot resolve. However, RCMs have limitations too. For example, they inherit the same problems and uncertainties as the global models that drive them.
The challenge of separating visual sophistication from real scientific value is being amplified by the rapid rise of experimental AI tools developed outside the weather and climate community. These models can produce visually striking, ultra–high-resolution outputs that resemble credible climate fields but often lack physical realism. Upon closer examination, many show patterns that are meteorologically implausible. While they may look impressive, such outputs should not be used without transparent, rigorous validation, something that is rarely performed in depth.
Until models are verified locally, higher resolution does not equal higher accuracy or higher predictive power. It may just mean a more visually detailed picture of the wrong answer.
Important questions to ask before considering high resolution climate model data:
- Has this data been evaluated and benchmarked against real-world observations?
- What are the accuracy limitations? Do these matter for my specific application?
- If AI methods are used, are they from a credible weather and climate source and extensively validated?
Myth #4: Climate threshold indicators like days over 90°F are estimates of risk
Climate indicators provide general hazard signals, not impact or risk estimates. Metrics like “days over 90°F” or the Fire Weather Index describe environmental conditions, while real-world consequences are shaped heavily by socio-economic factors, such as who and wha tis exposed, how systems are designed and operated, and what protections are in place.
Climate indicators like annual number of days over 90°F or fire weather index extremes can be calculated readily from downscaled climate model output fields. But these characterize physical hazards and, by themselves, do not equate to impacts like damage and financial loss. Impacts occur only when hazards interact with exposure (people, assets, and infrastructure in harm’s way) and vulnerability (how susceptible those assets or systems are to damage or disruption). Risk arises when hazards have the potential to interact with people, assets, and systems that are exposed and vulnerable.
For example, a one-foot flood depth occurring in a neighborhood may sound alarming but has no impact on a home with a base elevation two feet above the ground. Capturing true risk requires engineering insight and detailed local information—such as grading, foundation height, and construction type—that are typically only available with site visits. Without that context, hazard data alone provides an incomplete and sometimes misleading picture of risk.
“Risk scores” provided for simpler meteorological variables, such as rainfall, are particularly dubious. Rainfall itself is only one component of a broader hazard like flooding. Similarly, so-called drought risk scores overlook that real-world impacts depend on water management and infrastructure, not just meteorological dryness. In both cases, treating these variables as direct measures of risk oversimplifies the complex systems that determine actual outcomes.
In reality, impacts are more than the sum of hazard, exposure, and vulnerability. They arise from dynamic interactions across physical and social systems—referred to as compound and cascading risks.
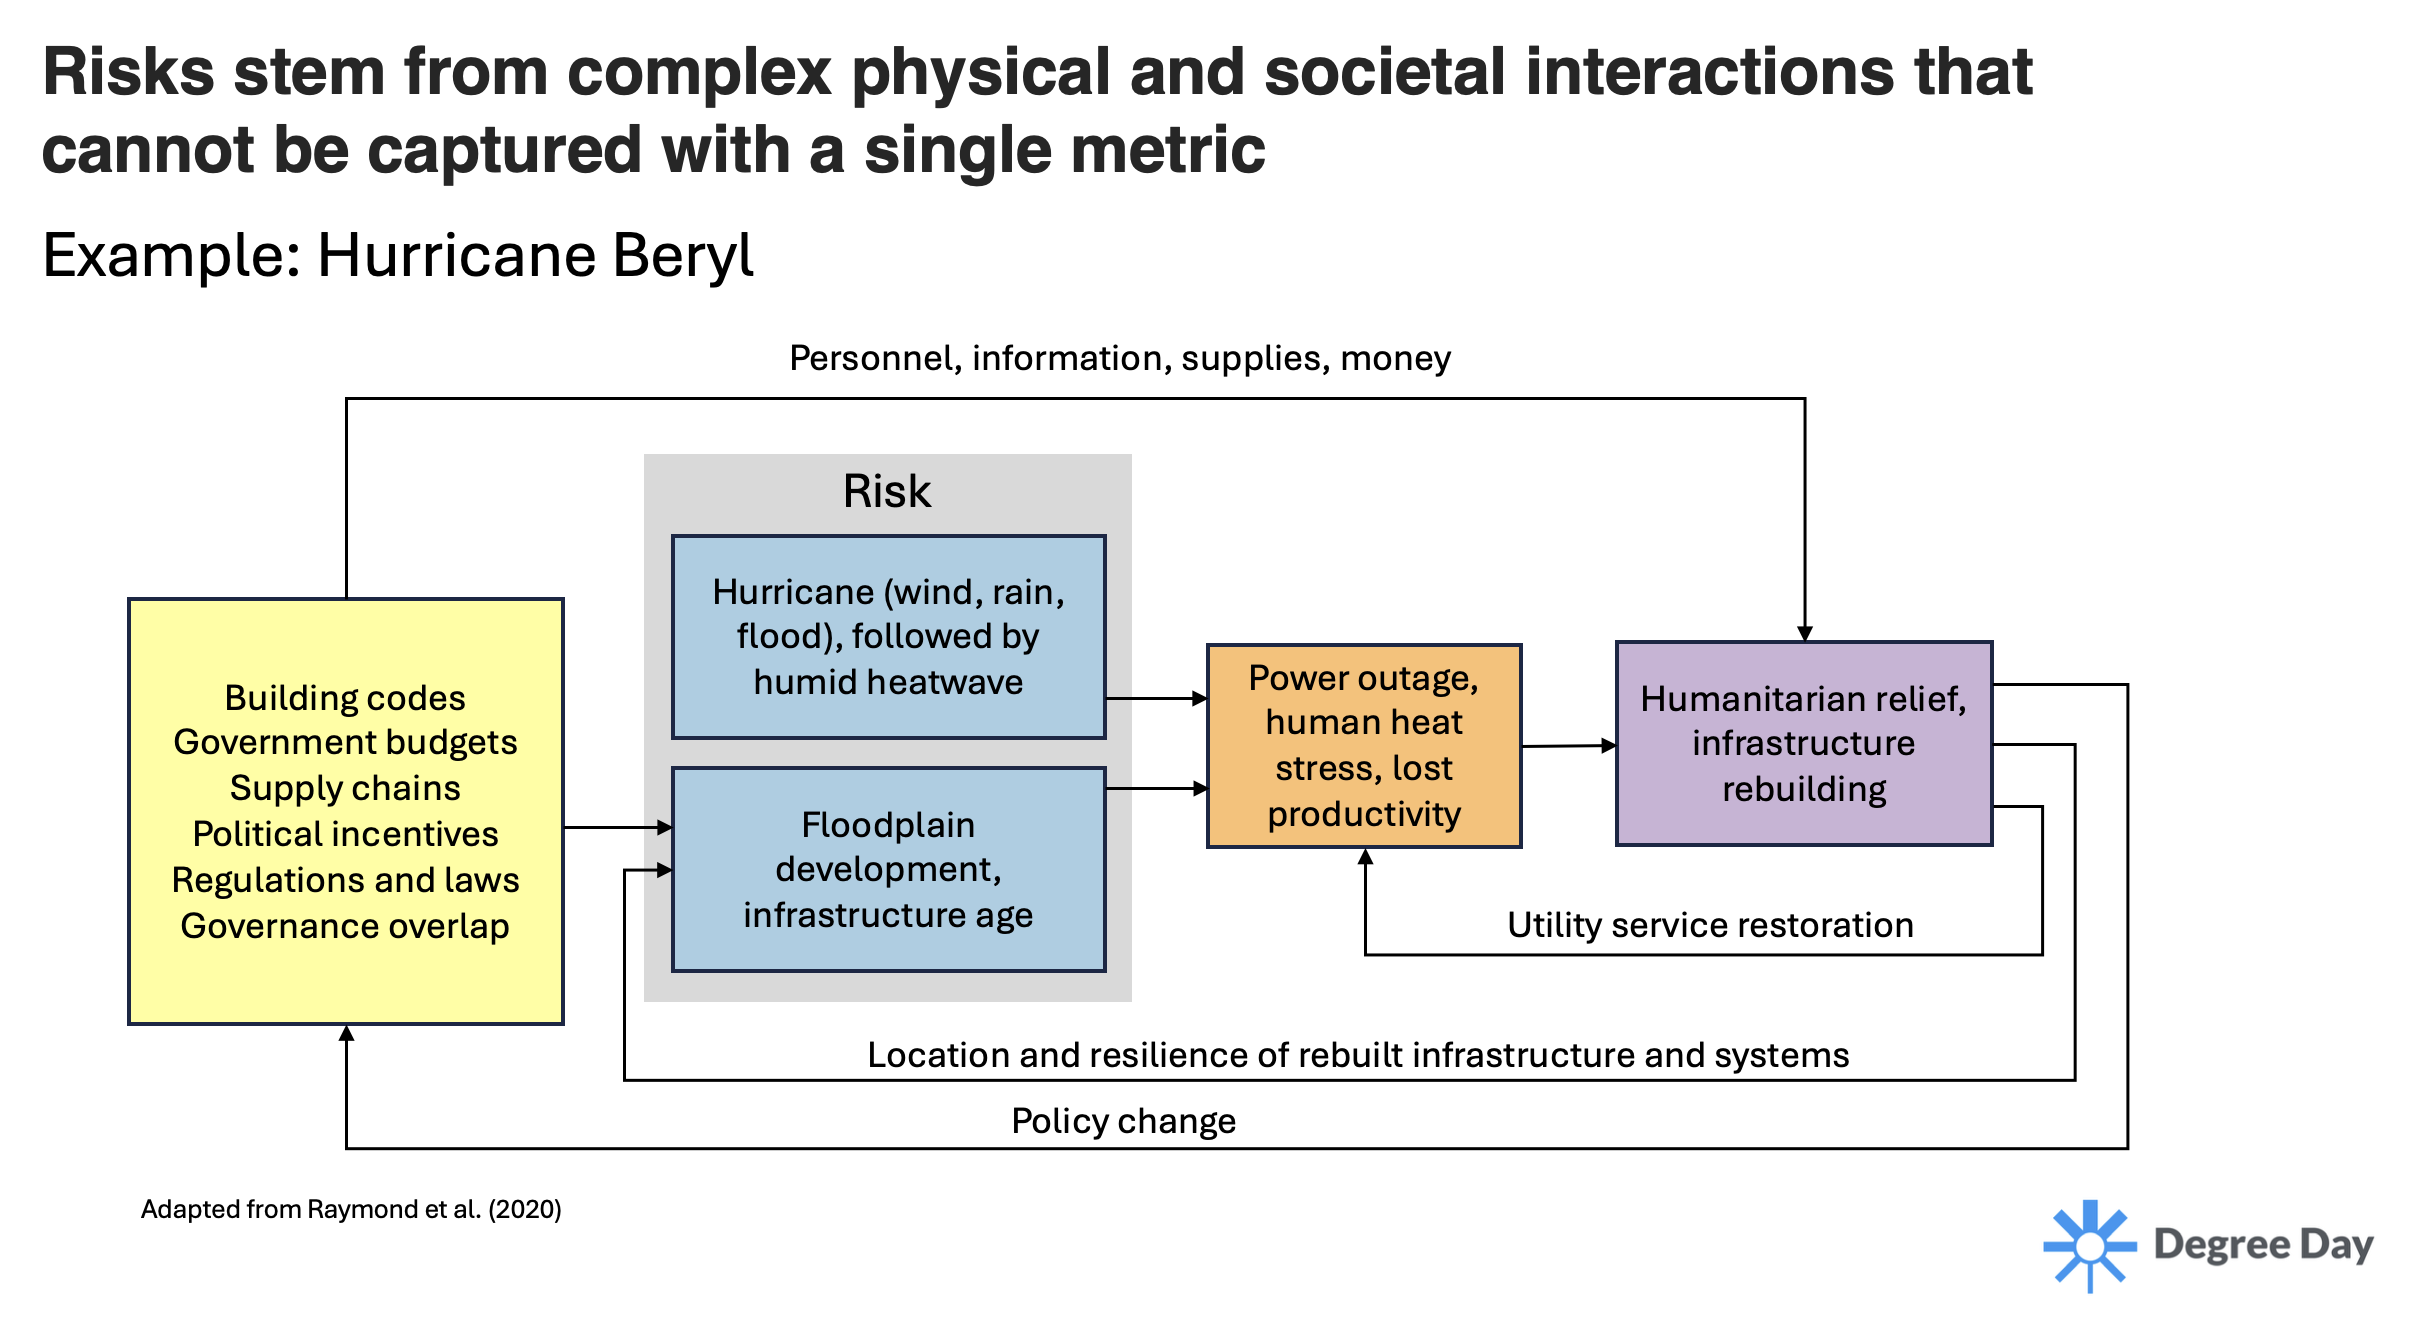
Consider Hurricane Beryl (2024), which involved multiple compounding hazards—strong winds, heavy rainfall, flooding, and a subsequent humid heatwave. These physical hazards interact with human systems such as floodplain development and aging infrastructure, which shape the overall impacts.
The diagram emphasizes that consequences such as power outages, human heat stress, and lost productivity result not only from the storm itself but also from underlying vulnerabilities like inadequate building codes, budget constraints, weak governance, and interdependent supply chains.
Recovery and rebuilding processes—such as humanitarian relief, infrastructure repair, and policy change—feed back into future risk levels through the resilience or fragility of rebuilt systems. The flow of personnel, information, supplies, and money links these stages, showing that disaster risk is dynamic and co-produced by both physical hazards and societal decisions.
These challenges in estimating impacts and risk should give pause to end users of data products that claim to provide “risk" scores, prompting them to more carefully scrutinize the information they rely on.
Important questions to ask:
1. Do your risk scores consider aspects beyond just hazards such as exposure, vulnerability and adaptive capacity?
2. Which hazard intensities (e.g., specific wind gust speeds or extreme temperatures) are most relevant to the specific asset or system?
3. Are compounding or cascading risks across systems important?
Limitations and General Considerations
Climate model outputs and “risk” scores are often portrayed as if they provide crystal-ball insight into the future—offering precise forecasts of local climate change and accurate estimates of the resulting economic impacts. While that narrative is compelling, it overstates what these tools can realistically deliver.
All models, no matter how sophisticated, are simplifications of reality. They provide structured ways to explore complex systems, but each carries inherent limitations. These limitations are often not understood or communicated, or if they are, they are reduced to superficial details—such as the number of climate models used (i.e., more is always "better"), downscaled data resolution, or whether the dataset is derived from CMIP5 or CMIP6 model output. This results in misuse of models in ESG and financial risk applications.
Bias correction can reduce systematic differences between modeled and observed climates, yet it cannot eliminate deeper structural errors or make models better predictors of the future. Similarly, higher spatial resolution may produce visually detailed maps but does not guarantee greater accuracy—especially when data have not been locally validated.
Climate models also struggle to fully represent many high-impact extremes such as floods, wildfires, and severe storms, which occur at scales finer than most models can resolve. Even when these hazards are downscaled, the apparent local detail often reflects statistical refinement rather than new physical understanding. Moreover, climate indicators like “days over 90°F” or drought indices describe environmental conditions, not actual risk. Real-world impacts depend on who or what is exposed, how systems are designed, and how adaptive capacity and governance shape vulnerability.
These nuances are frequently lost when data are distilled into dashboards or “risk scores” marketed as direct views of the future. Misinterpretation arises not only from model limitations but also from weak communication of assumptions and uncertainty. Robust analysis therefore requires integrating multiple lines of evidence—local observations, historical events, process-based research, and expert interpretation—rather than relying on any single dataset or model framework.
Used thoughtfully, climate and risk models can illuminate potential shifts in natural hazards and support more informed resilience planning. Used uncritically, they risk creating false precision and misplaced confidence in an inherently uncertain future.

