🌡️ ISO 7243 is the international standard for assessing occupational heat stress. It defines five risk categories based on the Wet-Bulb Globe Temperature (WBGT) — a composite index that integrates air temperature, humidity, wind, and solar radiation to represent the body’s true thermal load.
Consider the two highest ISO 7243 Categories:
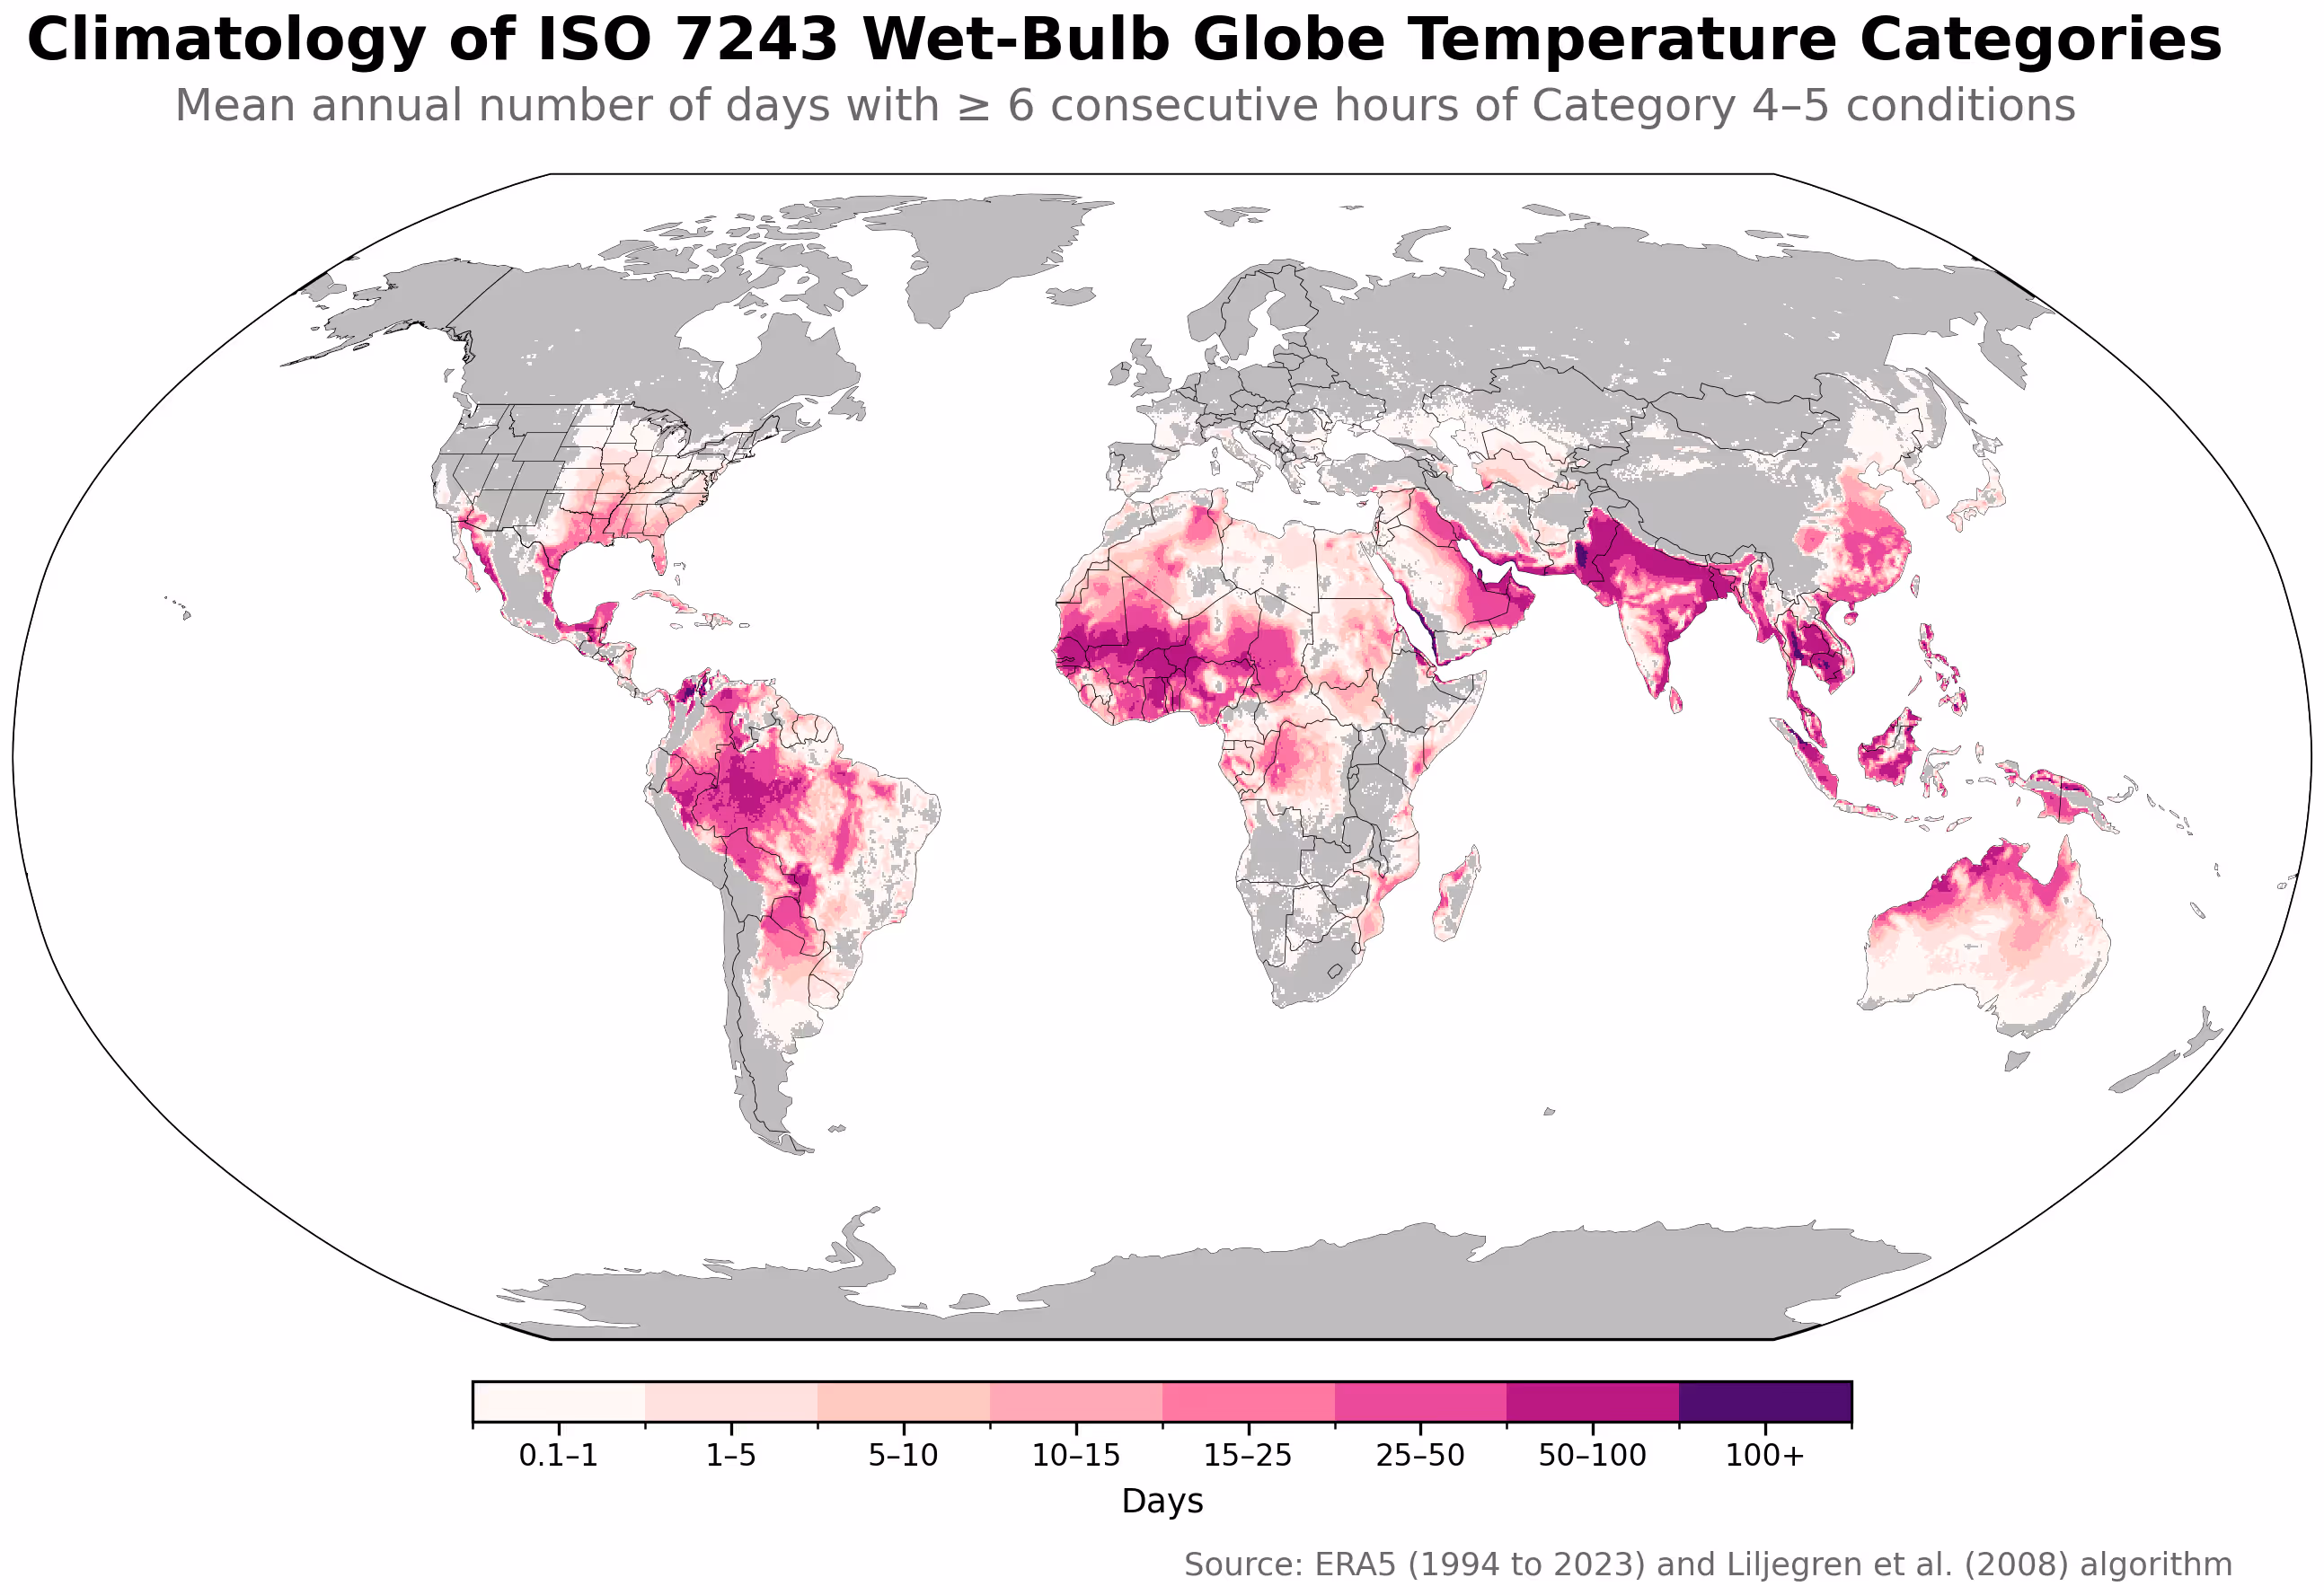
Category 4 (WBGT 30–33 °C) indicates severe heat stress, where only light work is recommended, and workers should follow strict 15/45-minute work/rest cycles. Sustained activity at this level can quickly lead to overheating without adequate hydration and recovery.
Category 5 (WBGT > 33 °C) represents extreme heat stress, where work should cease entirely. Even acclimatized and physically fit individuals are at high risk of heat strain and potentially life-threatening heat illness without rest, shade, and active cooling measures.
Exposure to these ISO WBGT categories has cascading impacts across systems that depend on temperature stability:
- 👷 Essential outdoor labor: reduced productivity, increased rest requirements, and heightened risk of heat-related illness
- 🧊 Refrigerated goods: higher spoilage risk and cold-chain disruption
- 🏥 Healthcare systems: more heat illness, emergency visits, and productivity loss
- 🐄 Livestock & agriculture: increased cooling needs and reduced yields or animal performance
- ⚡ Energy systems: surging cooling demand and greater peak-load strain
- 🏟️ Outdoor sports & events: heightened risks for athletes, spectators, and organizers
WBGT values in the maps are calculated using the Liljegren et al. (2008) physical formulation — the “gold standard” method that explicitly models radiation and surface energy balance.
Unlike simpler air-temperature approximations, the Liljegren method provides a more realistic measure of physiological heat stress, aligning far better with observed labor, productivity, and health outcomes.
The underlying data come from ERA5, a global weather reanalysis that assimilates real-world observations into a physically consistent model. While highly reliable for capturing large-scale atmospheric patterns, ERA5 — like all models — has limitations, particularly in representing microclimates and extreme local conditions.
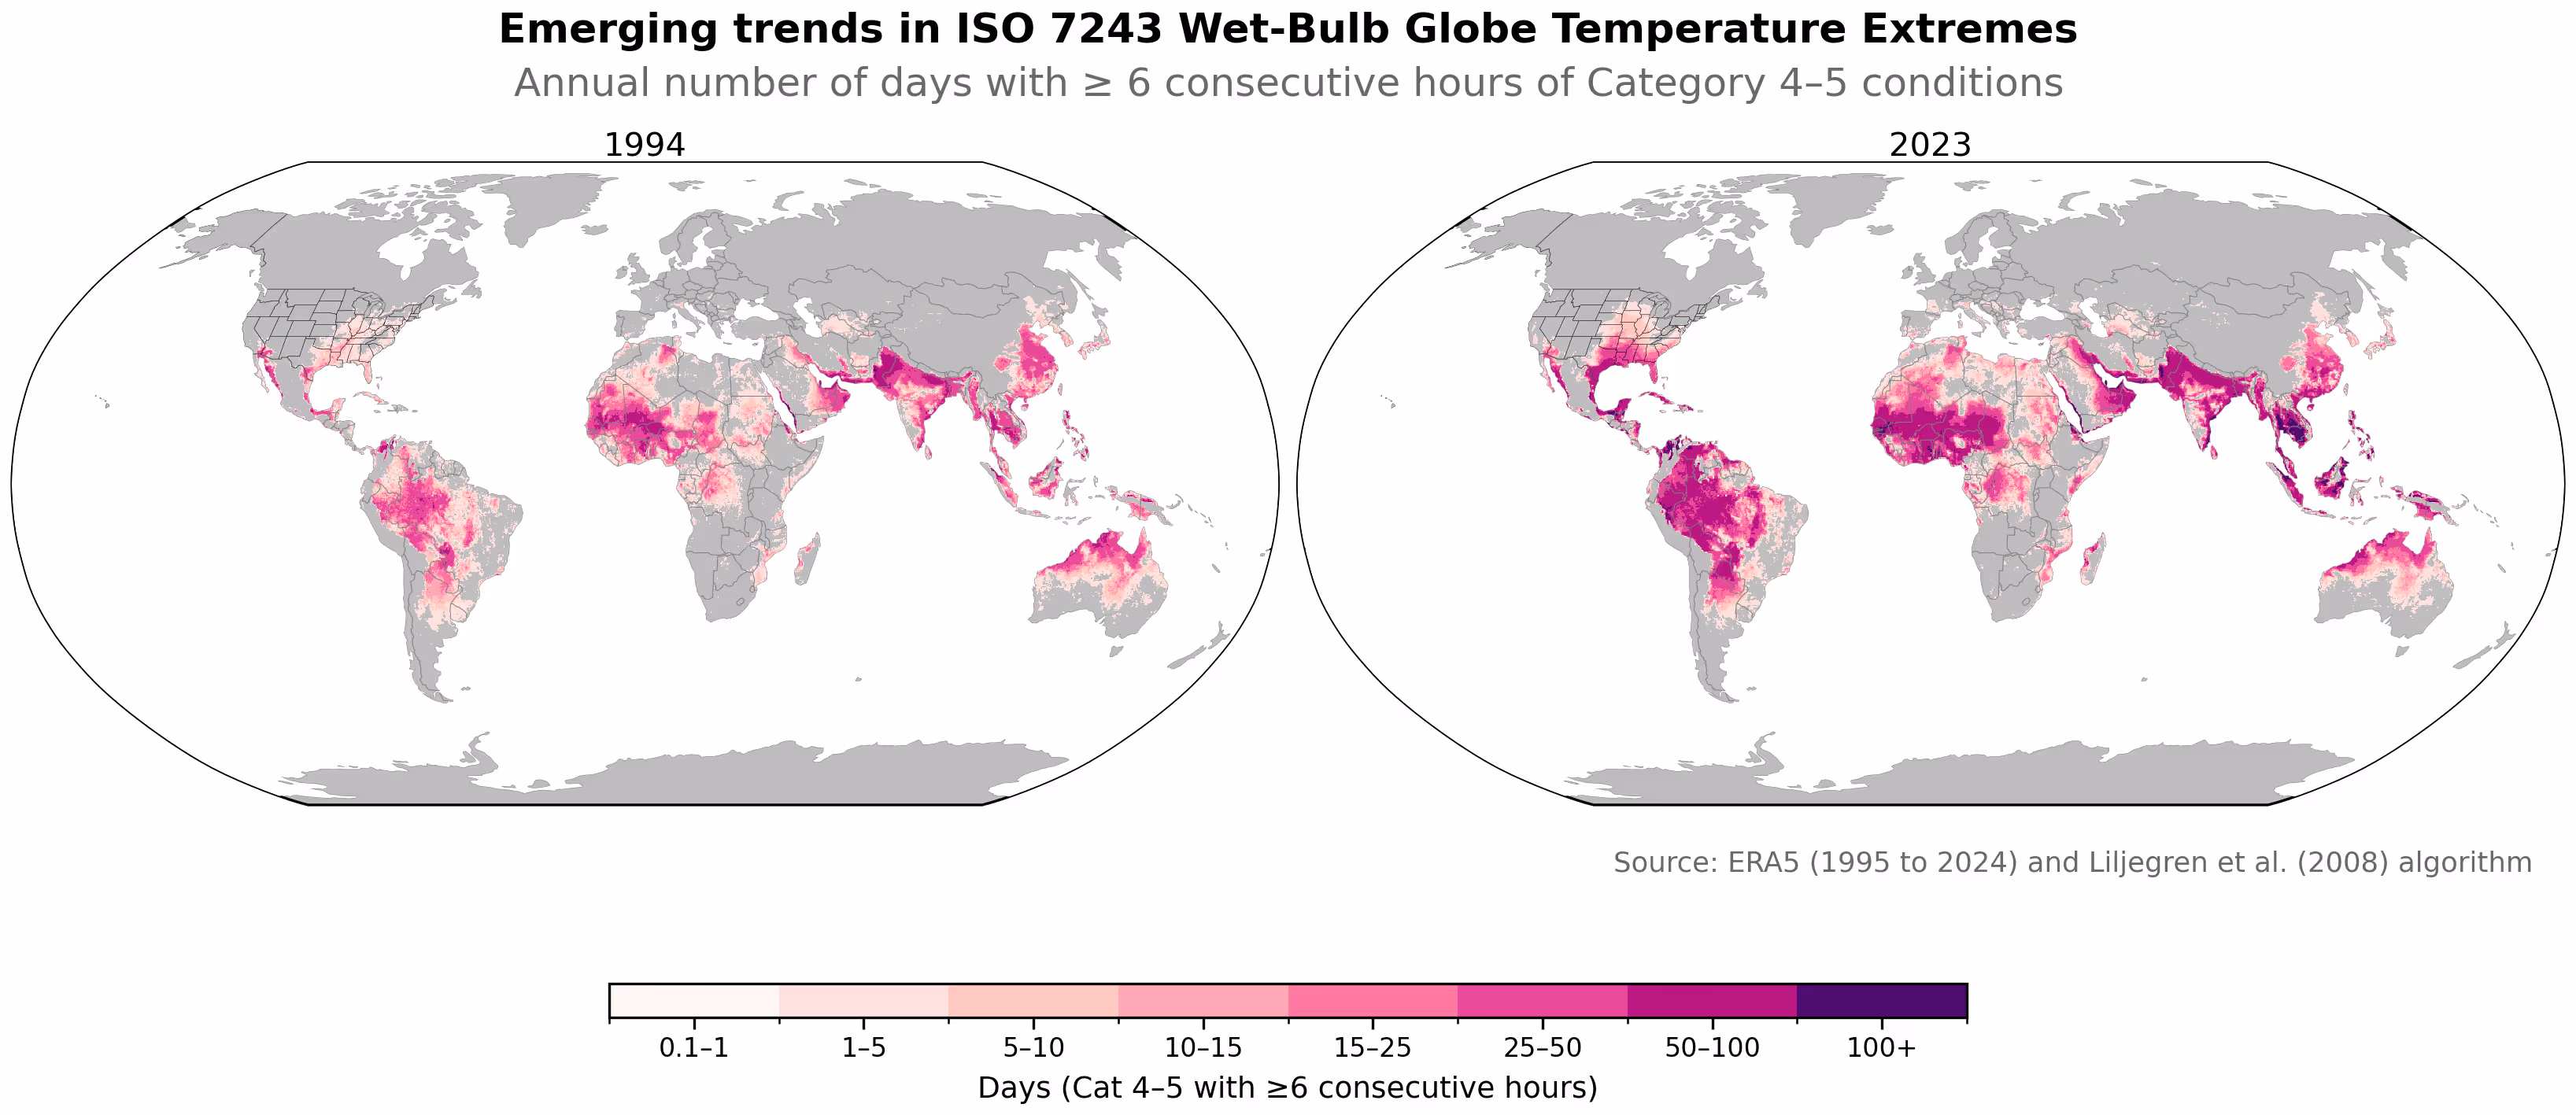
Climate model outputs can be used to project future changes in WBGT, but these projections carry considerable uncertainty at regional and site scales and may not align with observed trends.
On the other hand, observed trends can establish a more dependable foundation for identifying where dangerous heat exposure is already emerging — and where adaptive action is most urgently needed.
Acting Where Trends and Returns Align
It is important to recognize that climatological hotspots are often partially adapted to such extreme heat stress conditions through work practices, infrastructure, behavioral norms, and individual’s acclimatization. However, these same areas can still reveal weaknesses when planning and adaptation measures fall short.
Disruptions can be the greatest in regions that are exposed but not accustomed to such extremes. In these areas, limited adaptation and preparedness can amplify the impacts of even moderate heat events, leading to outsized effects on labor, health, and infrastructure systems.
Ultimately, human physiological limits impose a universal upper bound on how much heat stress can be tolerated, regardless of acclimatization.
Targeted adaptation can significantly reduce the impacts of heat stress but the return on investment depends on local context, and it’s rarely straightforward to generalize.
Unsure what extreme heat means for your workforce or assets? We can help you find out.
Degree Day helps organizations make sense of their specific weather and climate risks. With nearly two decades of experience, we’ve seen firsthand how often companies end up paying for tools that look impressive but fail to deliver real insight or value.
No pushy salespeople. No inflated consulting fees. Just real experience, clear answers, and practical insight where it matters most.

