Climate models can be powerful tools for decision-making, if applied appropriately. Most practitioners today rely on spatially downscaled climate model data as opposed to raw outputs because they generally better represent local climates.
There are two main approaches for spatial downscaling:
- Statistical refinement, which uses statistical relationships between large-scale model outputs and local estimates of climate
- Dynamical refinement, which uses regional climate models to simulate physical processes directly.
Most of the high-resolution climate datasets in use today are produced through statistical refinement. This approach is computationally efficient, allowing many global models to be quickly downscaled, and the resulting products are widely distributed through centralized repositories. As a result, most engineers and designers rely on these datasets, not necessarily because they are the most physically robust, but because they are the most accessible and convenient to use.
The catch? Many of these products appear highly spatially detailed, but the added resolution is often cosmetic and not grounded in physical processes. Statistical refinements typically re-grid or adjust coarse global climate model output (for example, 1.5° × 1.5°) to match historical climatology at finer scales (e.g., 0.25° × 0.25°). This improves visual detail but does not add new physics about how local processes may respond to a warming climate. The result may not always be suitable for high-stakes, engineering-grade decisions. Alternatively, regional climate models provide a more physically based alternative to statistical “eye candy”.
What Are Regional Climate Models (RCMs)?
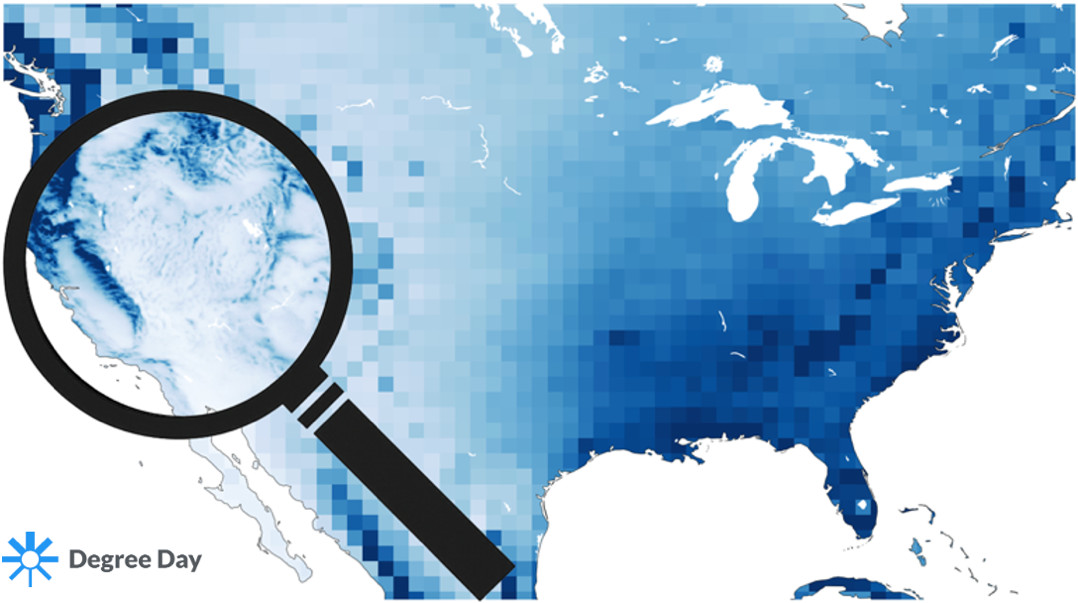
Regional climate models are high-resolutions versions of climate models that work like their global counterparts, but at a much finer resolution; typically 10–50 km, over continental scales or smaller. Regional climate models use global models as boundary conditions and then simulate regional climate at higher spatial and temporal resolution within the boundary. Think of them as “magnifying glasses” for global models: they zoom in on regional and local processes that global models cannot resolve. By doing so, they add physical realism in a targeted area.
Regional Climate Models: Strengths and Limitations
Regional climate models offer many benefits. Unlike statistical refinements, which merely post-process global model output, regional climate models dynamically simulate the processes that shape local climates using physical laws. They can capture phenomena relevant to the built environment such as alpine winds, sea breezes, tropical cyclones, and heat waves. This makes regional climate models particularly valuable for engineers and designers who need climate information tied to real physical processes rather than added-on cosmetic spatial detail.
At the same time, regional models have limitations. They inherit biases from the global models that drive them, are very computationally expensive to run, and cannot fully correct large-scale circulation errors (the problem of “garbage in, garbage out”). Their outputs also require bias adjustment before use in practical applications, a complex process that introduces its own assumptions.
In short, regional climate models add physical realism at local scales, but they are not turnkey. They still need to be further calibrated to local conditions before being used in infrastructure or risk analyses.

Why Regional Climate Models are useful for Infrastructure
Regional climate models give practitioners something statistically refined global models cannot: locally relevant climate information determined using physics. By resolving mountains, coastlines, and valleys, they simulate the regional processes such as sea breezes, orographic rainfall, and land–atmosphere feedbacks that shape real-world weather, now and into the coming decades. This local detail is essential for infrastructure projects where site-specific conditions drive design.
Equally important, regional climate models can improve the simulation of extremes and thresholds. Heavy rainfall, heatwaves, cold snaps, and tropical cyclones are often blurred out in global models, but these phenomena strongly influence engineering standards for stormwater systems, bridges, electric power grids, and building codes. For the built environment, extremes, rather than averages, typically define risk.
Beyond temperature and precipitation, regional climate models provide a broad suite of variables including humidity, surface wind, snow, cloud cover fraction, and solar radiation. These support energy demand modeling, renewable resource assessment, and grid reliability planning. They also enable the calculation of decision-grade indicators such as clear-sky days, freeze–thaw cycles, cooling degree days, or humid hot days that practitioners can use directly.
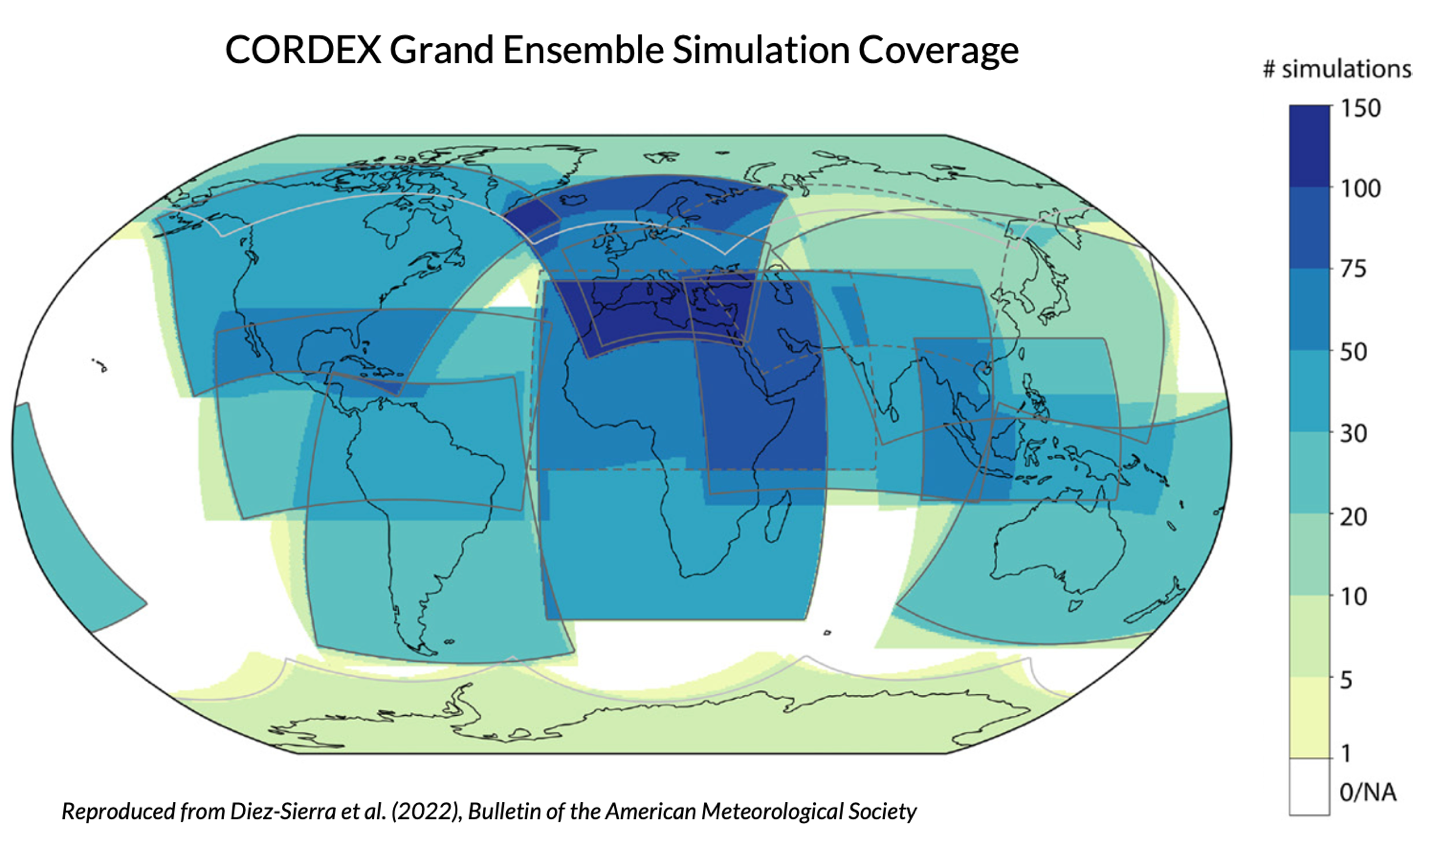
CORDEX: A Global Ensemble of Regional Climate Models
CORDEX (Coordinated Regional Climate Downscaling Experiment) is a globally coordinated effort to produce high-resolution climate projections using regional climate models. With grid spacing as fine as ~12 km (7.5 miles), the CORDEX Grand Ensemble offers near-global, multi-model, multi-scenario projections through 2100—making it a valuable resource for engineering design, energy planning, and climate resilience analysis.
Unlike popular statistical downscaling datasets such NEX-GDDP, GDPCIR, and LOCA which re-grid and bias adjust global model output using statistics, CORDEX models dynamically simulates the atmosphere, land, and ocean at much higher resolution using physics. This allows CORDEX models to capture critical drivers of local climate that statistical methods cannot. For practitioners, that means physically consistent projections of patterns and extremes, not just visually detailed maps that may not adhere to physical laws.
CORDEX was released in parallel with CMIP6 and continues to underpin the most recent IPCC assessments. In fact, CORDEX provides the only downscaled projections included in the IPCC Climate Atlases, while statistical downscaled products are not featured. This matters for practitioners because using CORDEX means working with projections that are physically consistent and recognized at the highest international level. Engineers and planners can have confidence that their designs are based on science that adheres to the high standards of the IPCC.
The next-generation global CORDEX ensemble, driven by CMIP6, will not be fully available until the late 2020s, at which point CMIP7 models will be released to the public. Climate model generations can overlap rather than replace one another, and CORDEX remains one of the most spatially detailed and physically grounded sources of climate projections available today.
CORDEX brings the physics, Degree Day brings the usability
CORDEX offer unparalleled physical realism, but raw outputs alone are not enough for engineering-grade decisions. The challenge lies both in how the data are delivered and in the fact that they are not calibrated to local climates.
This is largely why CORDEX is rarely used in global climate risk assessments. Projections are fragmented across thousands of files on multiple servers, inconsistently formatted, and not bias-adjusted, making them difficult to apply in practice. Without further processing, they remain closer to research products than decision-ready tools. This creates a barrier between state-of-the-art science that CORDEX offers and actionable insights.
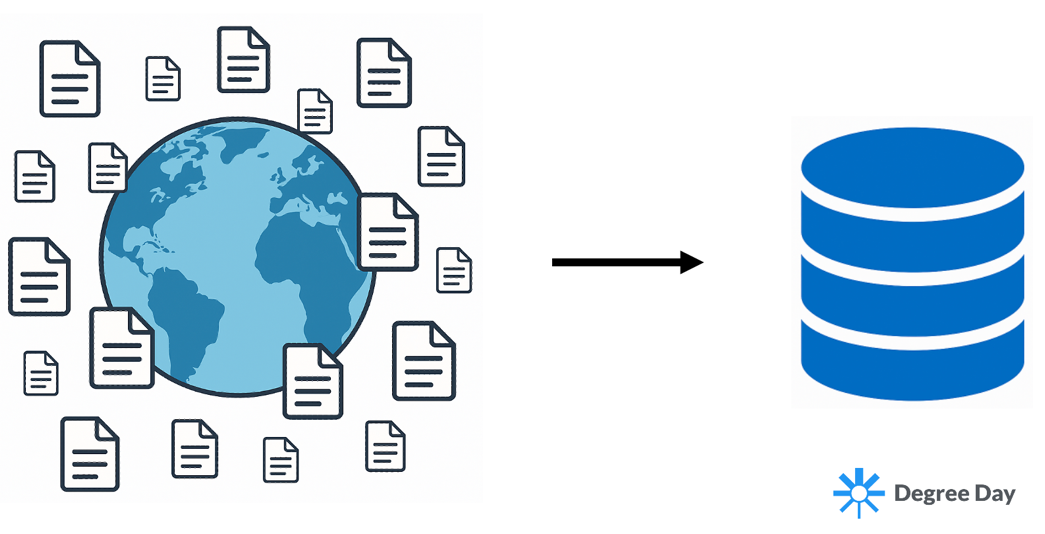
At Degree Day, we close this gap and make the model outputs useable for real-world planning. By transforming raw CORDEX simulations into harmonized, locally calibrated datasets, we make these one-of-a-kind climate projections analysis-ready to produce insights for high-stakes global applications. The result is a uniquely powerful dataset. CORDEX offers physical realism that is rarely used in practice, and Degree Day makes it accessible and calibrated for applied use. This gives engineers, planners, and climate risk professionals a unique perspective on climate risk that would otherwise remain locked in scientific archives.

Can I have a copy of your cleaned, analysis-ready version of the global CORDEX ensemble?
Yes. Degree Day has already done the hard work for you. Over several months, we downloaded, cleaned, and organized more than 150,000 CORDEX NetCDF files across multiple variables and regions. The result is a harmonized global ensemble in Zarr format—ready for cloud-based analysis at scale.
Whether you’re conducting climate risk assessments, engineering studies, or large-scale model intercomparisons, our curated global CORDEX archive can save you hundreds of hours in data wrangling, letting you focus on analysis instead.
If you would like to learn more, send an email to info@degreeday.org
References:
Ashfaq, M. (2023, November 20) The low-resolution secrets of high-resolution statistical downscaling. The MyClimateBlog. https://www.myclimateblog.com/post/the-low-resolution-secrets-of-high-resolution-statistical-downscaling
Hong, S.-Y., & Kanamitsu, M. (2014) Dynamical downscaling: fundamental issues from a numerical weather prediction point of view and recommendations. Asia-Pacific Journal of Atmospheric Sciences, 50(1), 83–104.
Maraun, D., & Widmann, M. (2018) Statistical downscaling and bias correction for climate research. Cambridge University Press. DOI: 10.1017/9781107588783
Diez-Sierra, J., et al. (2022) The worldwide C3S CORDEX Grand Ensemble: A major contribution to assess regional climate change in the IPCC AR6 Atlas. Bulletin of the American Meteorological Society, 103(12), E2804–E2826. DOI: 10.1175/BAMS-D-22-0111.1
Intergovernmental Panel on Climate Change (IPCC). (2021) Atlas. In V. Masson-Delmotte, P. Zhai, A. Pirani, S. L. Connors, C. Péan, S. Berger, N. Caud, Y. Chen, L. Goldfarb, M. I. Gomis, M. Huang, K. Leitzell, E. Lonnoy, J. B. R. Matthews, T. K. Maycock, T. Waterfield, O. Yelekçi, R. Yu, & B. Zhou (Eds.), Climate Change 2021: The Physical Science Basis. Contribution of Working Group I to the Sixth Assessment Report of the Intergovernmental Panel on Climate Change. Cambridge University Press. https://www.ipcc.ch/report/ar6/wg1/chapter/atlas/

