The Case for Observation-Calibrated Climate Data
Weather and climate profoundly influence architecture, engineering, and energy system design. For these applications, the utility of weather and climate data largely depends on its accuracy and its ability to represent the location of interest. Historically, in-situ observations from weather stations have provided the most reliable reference for climate baselines. These ground-based observations remain the gold standard, offering the closest approximation to “ground truth.”
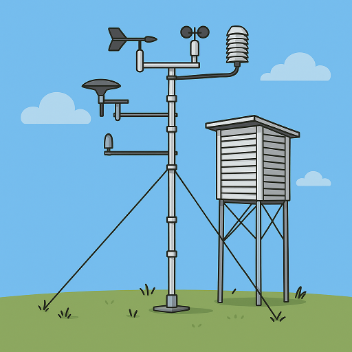
Weather stations are used by many professional organizations to set design standards to ensure infrastructure functions under extreme conditions. One such example is ASHRAE (American Society of Heating, Refrigerating, and Air Conditioning Engineers), who provide climatic design day information for thousands of weather stations around the world to inform heating and cooling systems. However, in recent years, these accurate datasets are being passed over for other sources that are more convenient to work with but are generally not substitutes for high-quality in situ observations.
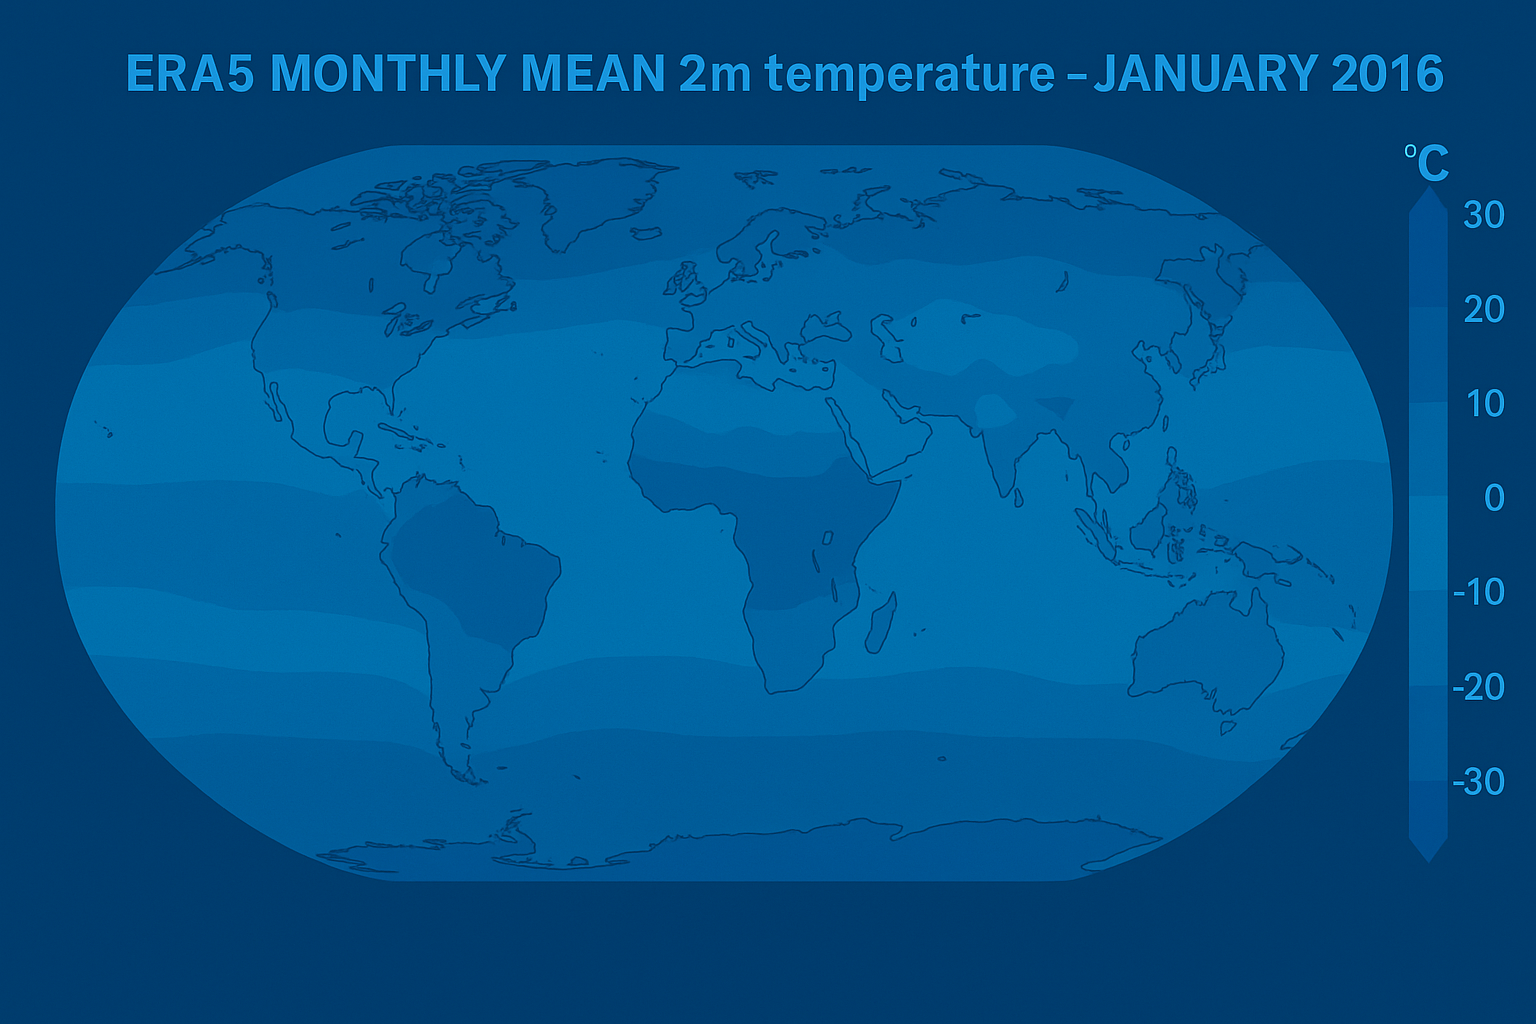
In recent years, gridded weather datasets such as ERA5 are increasingly being used by climate risk practitioners, including being used to inform engineering design, asset-level risk assessments, and resilience planning. ERA5 provides globally complete, hourly data spanning over eight decades, derived from a combination of observations and numerical weather prediction models. Its spatial coverage, temporal resolution, and cloud-based accessibility make it an attractive alternative to observational data.
This presents a challenge:
ERA5 is not always a direct substitute for observations.
While ERA5 can produce realistic spatial and temporal patterns, the actual values themselves and their variability can diverge significantly from observed conditions at weather stations. This can be problematic for applications requiring local accuracy.
Why ERA5 is not a direct substitute for station observations
There are two primary reasons why gridded datasets differ from observations.
“Area” versus “Point” perspectives
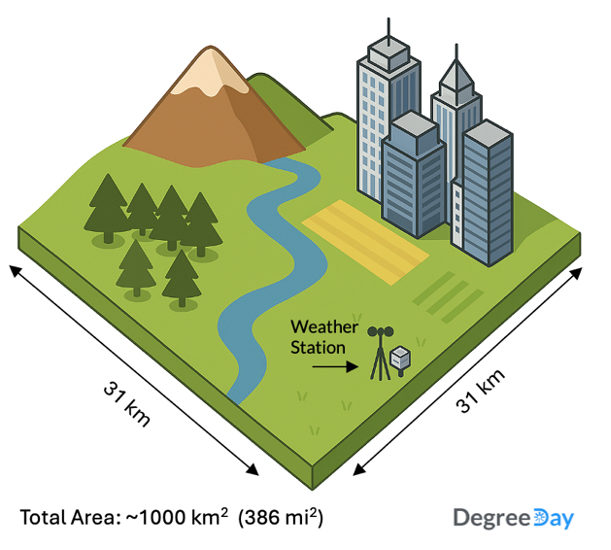
While most risk assessments are undertaken looking at specific assets like facilities and campuses, gridded datasets like ERA5 provide area-averaged estimates over a model grid cell; they are not designed to represent conditions at a single point. However, in practice, they are frequently used in this manner, particularly in climate risk assessments that require asset-level precision.
An ERA5 grid cell has a horizontal resolution of about 31 km (depending on the latitude). This is roughly 1000 km2 (half the size of Rhode Island). Averaging over a large area can smooth out extremes and sharp climate gradients (e.g., coastlines, urban heat islands, mountains) and fail to capture key local features, including microclimate effects that affect infrastructure and energy systems. This is not the fault of the datasets like ERA5 as they were not designed for these purposes. However, they are still used by climate risk practitioners in ways as if they were intended to assess point conditions. Treating the data in this way can have material consequences for applications that demand high levels of local accuracy.
Modeling Limitations
Gridded atmospheric datasets are produced using statistical methods or physically based numerical weather prediction models. The model structure, data assimilation techniques, and spatial resolution can all contribute to systematic differences from observed data. Even when they assimilate observations, reanalysis products like ERA5 can misrepresent both individual weather events and local mean climatological conditions.
Comparisons between ERA5, GMFD, and station observations
To illustrate the differences between gridded weather datasets and direct observations, Degree Day compared two widely used gridded climate datasets against in-situ weather station data from HadISD, a curated archive of high-quality hourly weather observations.
- ERA5 – A leading global reanalysis dataset produced by ECMWF
- Global Meteorological Forcing Dataset (GMFD) – A hybrid product combining surface observations with NCEP reanalysis
GMFD is not as popular as ERA5, but it is the historical reference used by NASA’s NEX-GDDP, one of the most commonly used downscaled climate datasets among insurance companies and climate risk and resilience consultants.
As a simple example, we examined the average number of days per year exceeding 90 °F across thousands of weather station locations. Data from the gridded products were extracted from the weather station coordinate using bilinear interpolation. On the maps, the hexagons represent groups of weather stations that have been binned for easier visualization.
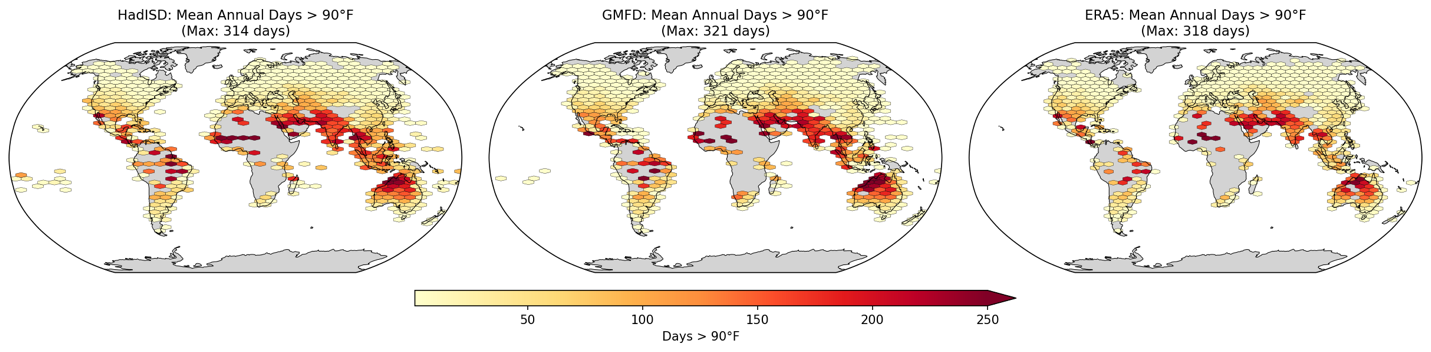
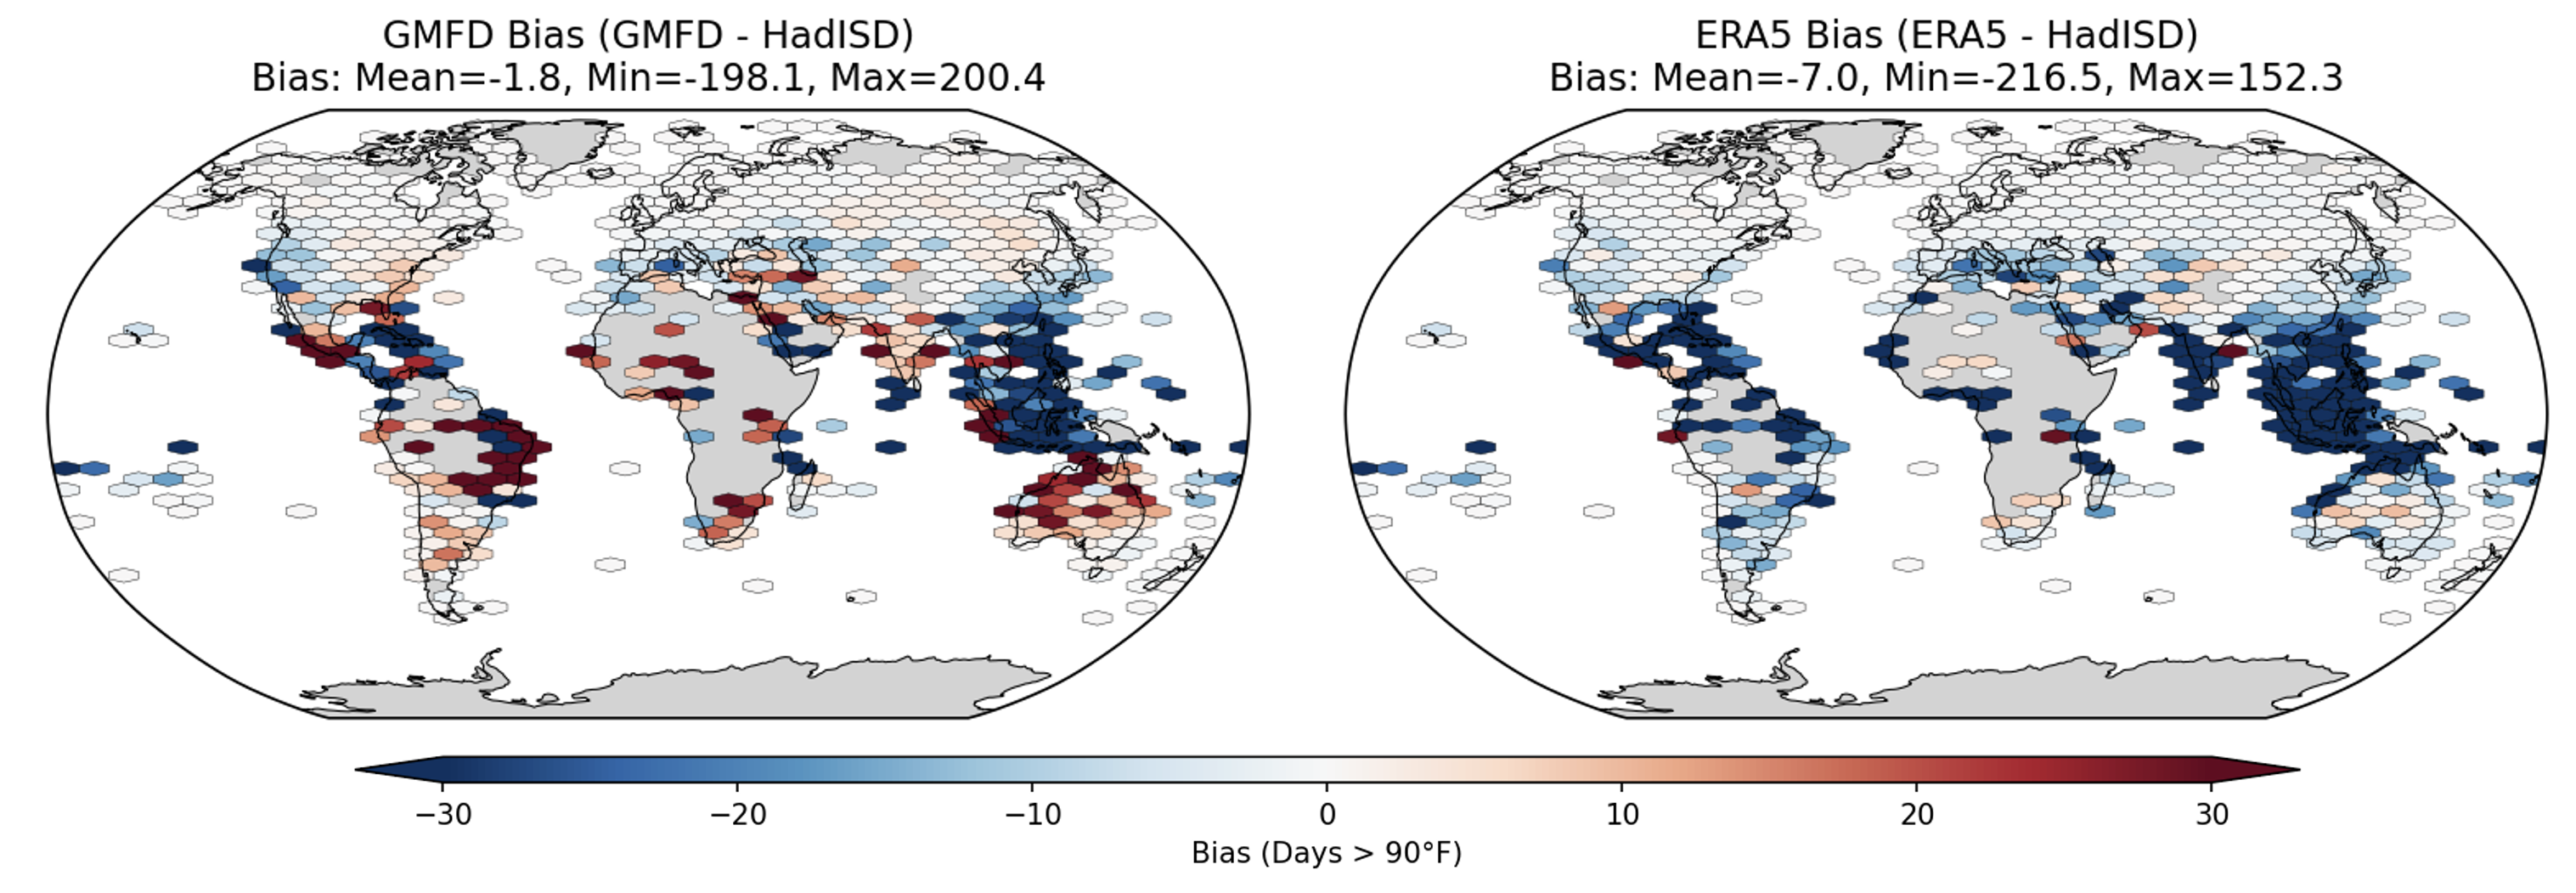
At first glance, ERA5 and GMFD appear to reasonably match the observational data. However, a closer look reveals significant differences.In many regions, especially in coastal zones and tropical areas, both gridded datasets exhibit substantial bias relative to in-situ observations. In some cases, these datasets over- or under-estimate 90 °F days by up to 200 days per year.
This is just one example of a climatological indicator to illustrate these differences. There are many more that consider other variables such as humidity, wind speed, and solar radiation that also exhibit noticeable differences between model and observations. Additional comparisons can be viewed here.
Why Accuracy Matters
There are material reasons why the fidelity of weather and climate data is critical for engineering design, risk analysis, and other applications that depend on accurate environmental inputs.
1. Biased Baselines Lead to Biased Future Climate Projections
Training climate model bias adjustment algorithms on biased data will propagate those biases forward. ERA5 and GMFD are commonly used to calibrate climate model projections. But if these foundational datasets are biased with respect to station observations (which they are commonly assumed to represent), then any future climate projection derived from them will carry forward those biases, potentially resulting in under-designed infrastructure, underestimated exposure, or misguided adaptation strategies.
Employing climate adjustment training data that does not well represent the baseline climate is like a pharmacy using a broken scale to dose medicine: all of its customers will get the wrong number of pills.

While future climate change is inherently uncertain, the projections should at least represent the climatological baselines as accurately as possible. In some cases, the reference data bias can be larger than the changes projected by the climate models themselves. When that happens, the climate change signal one is trying to detect is drowned out by biases in the baseline, reducing the reliability of the results.
One example is the saturation of “annual days over threshold” counts. For instance, if a biased baseline already shows more than 360 days per year exceeding 90 °F, despite observations showing only 50 to 60 such days, then there is very little room for the model to show a meaningful increase over time. The exceedance count becomes saturated, masking the true signal of climate change. Current exposure ends up being overstated and future changes in exposure are understated.
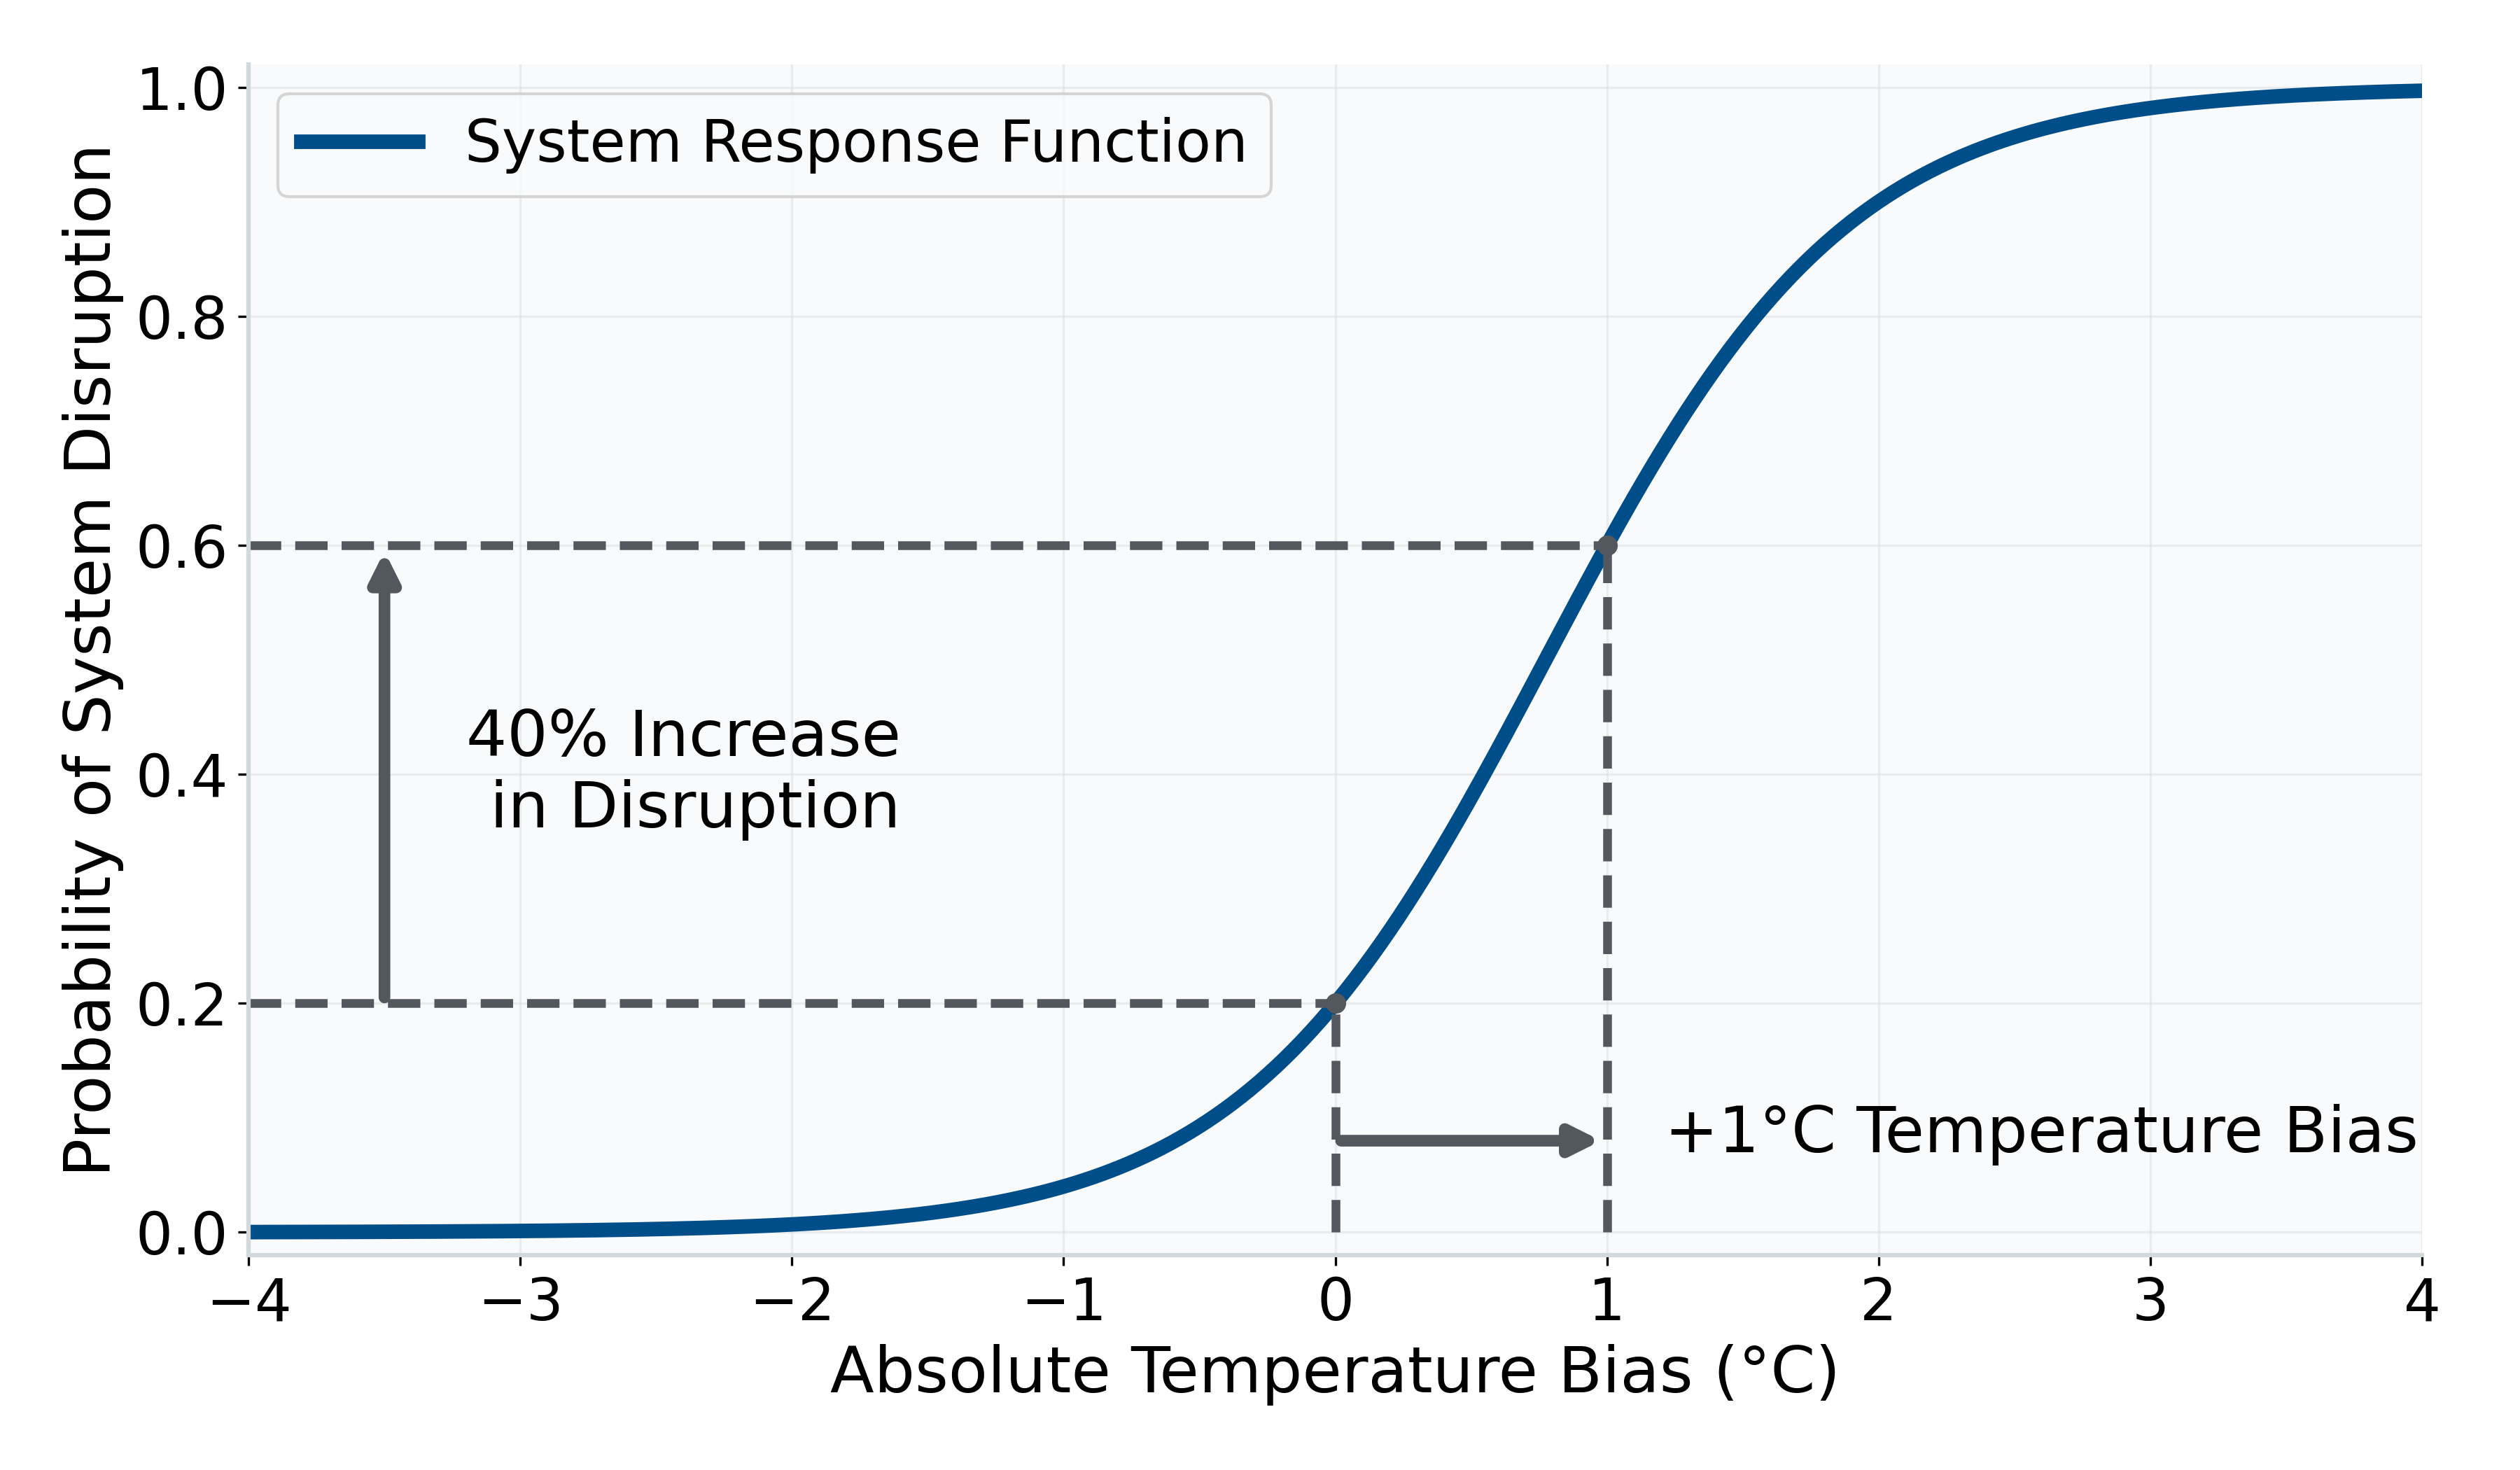
2. Small Biases Can Have Big Consequences
Infrastructure disruptions can have non-linear relationships with physical climate parameters, like temperature. For example, a +1 °C bias in baseline temperature could translate into large changes in energy demand, building load profiles, material degradation rates, or even public health risks. This can cascade into significant miscalculations, opening the door to increased costs, performance failures, or liability exposure.
3. Accuracy Builds Confidence and Credibility
Data that aligns closely with observed conditions does more than improve technical outcomes; it builds trust with end users. Whether you're engaging engineers, clients, regulators, or community stakeholders, analytical transparency and agreement with real-world observations enhances confidence in both the process and the results. This trust is essential when asking decision-makers to plan for future risks or invest in long-term resilience.
Benchmarking models against observed data, which may differ significantly from ERA5, is not just best practice; it also strengthens the credibility of climate model projections. Showing how historical trends align (or do not) with future scenarios reinforces confidence when they align and prompts important scrutiny and local calibration when they do not. Both outcomes are valuable for informed decision-making.

Introducing SCOPE-ERA5: A Station-Calibrated Climate Dataset for Planning and Engineering
To address the accuracy challenges of gridded weather datasets, Degree Day has developed SCOPE-ERA5 (Station-Calibrated Outputs for Planning & Engineering), a post-processed version of ERA5 spanning 1979 to 2024. Designed specifically for planning, engineering, and climate risk applications, SCOPE-ERA5 delivers improved local accuracy in ERA5 weather variables by applying a peer-reviewed, multivariate bias correction algorithm trained on high-quality weather station records.
SCOPE-ERA5 enhances the accuracy of key variables relevant for infrastructure and energy, such as temperature, humidity, and wind speed, while preserving the observed physical relationships between them. The result is a gap-free, thermodynamically consistent, multivariate dataset that more closely aligns with real-world conditions.
In the example shown earlier, SCOPE-ERA5 significantly reduces the bias in the number of days exceeding 90 °F, one of many improvements in the representation of variable time series and extreme conditions. Further improvements can be viewed in the technical document here.
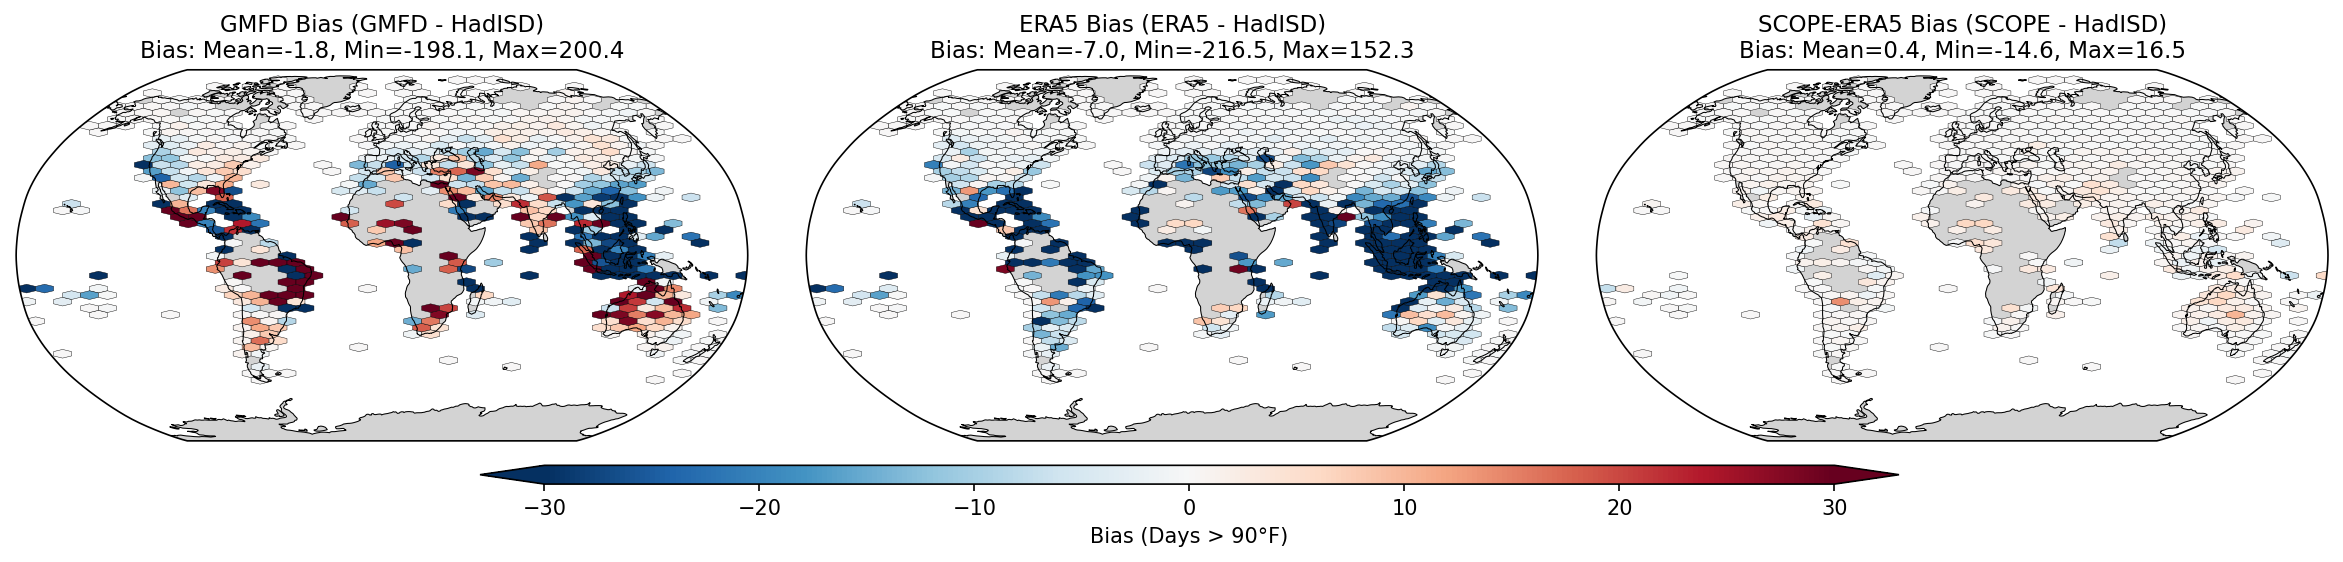
SCOPE-ERA5 significantly improves the accuracy of climate data by eliminating mean bias and reducing root mean square error (RMSE) at the majority of weather stations, ranging from 52% to 96%, depending on the variable. The biggest improvements are seen in wind speed. Importantly, tests at sites outside the training period show that the adjustment holds up over time, with only slight drops in performance, indicating strong temporal stability.
An extensive technical document detailing the methodology, benchmarking, and evaluation of SCOPE-ERA5 is available here.
SCOPE-ERA5 paves the way for improved assessments that reduce bias in the climatological baseline period by offering a multivariate, observation-calibrated dataset that aligns closely with real-world station data. SCOPE-ERA5’s internal consistency across temperature, humidity, wind speed, surface pressure, and solar radiation ensures that derived indices—such as heat index, wet-bulb temperature, and diurnal ranges—are locally realistic, capture extreme conditions, and adhere to thermodynamic laws.
Interested in exploring SCOPE-ERA5?
Degree Day is committed to advancing climate risk research and provides SCOPE-ERA5 data for non-commercial research applications. Several global climatological indicators and a subset of the daily time series at stations in the United Kingdom are available for download on Zenodo (netCDF and Excel formats). The full dataset is available upon request.
For more information or to request access for other uses, please view the product sheet here. Always feel free to contact us for more information: info@degreeday.org

